. 2007 Jul;19(7):2169-85.
doi: 10.1105/tpc.107.052068. Epub 2007 Jul 13.

Multilevel interactions between ethylene and auxin in Arabidopsis roots

Affiliations

Multilevel interactions between ethylene and auxin in Arabidopsis roots

Anna N Stepanova et al. Plant Cell. 2007 Jul.

Abstract

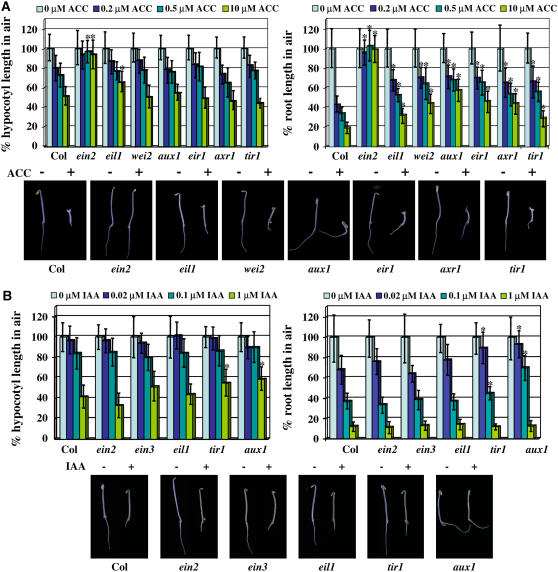
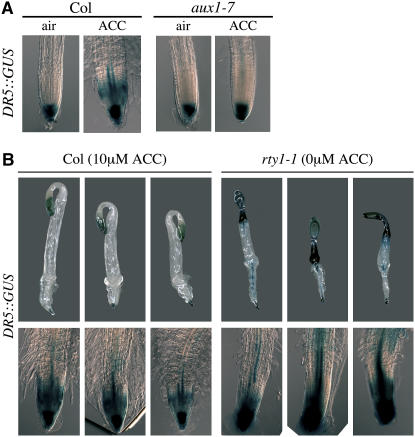
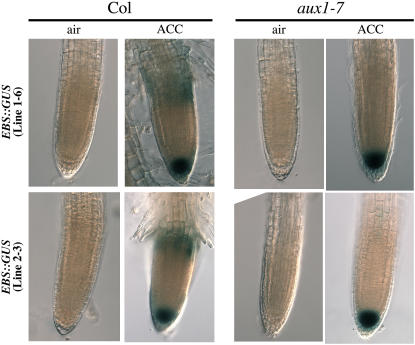
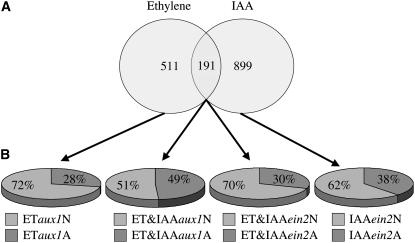
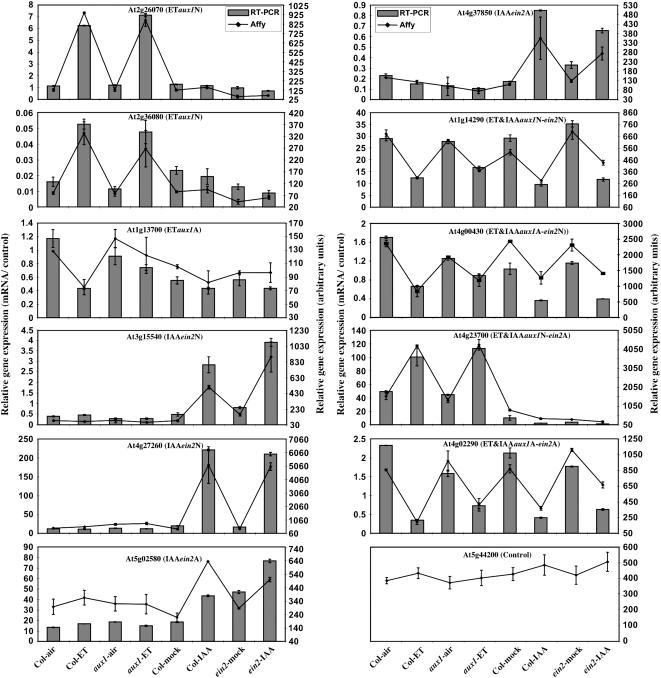
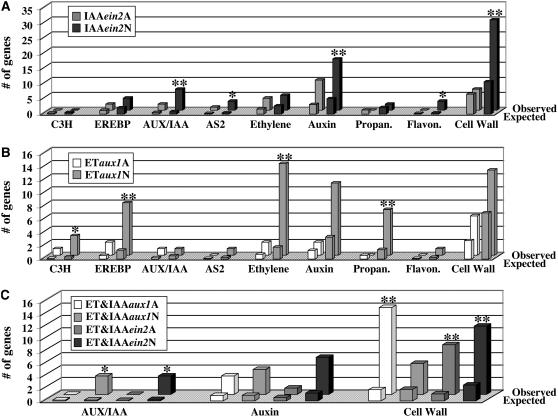
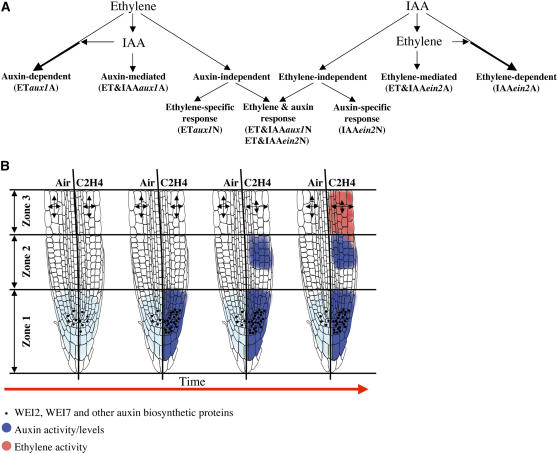
Hormones play a central role in the coordination of internal developmental processes with environmental signals. Herein, a combination of physiological, genetic, cellular, and whole-genome expression profiling approaches has been employed to investigate the mechanisms of interaction between two key plant hormones: ethylene and auxin. Quantification of the morphological effects of ethylene and auxin in a variety of mutant backgrounds indicates that auxin biosynthesis, transport, signaling, and response are required for the ethylene-induced growth inhibition in roots but not in hypocotyls of dark-grown seedlings. Analysis of the activation of early auxin and ethylene responses at the cellular level, as well as of global changes in gene expression in the wild type versus auxin and ethylene mutants, suggests a simple mechanistic model for the interaction between these two hormones in roots, according to which ethylene and auxin can reciprocally regulate each other's biosyntheses, influence each other's response pathways, and/or act independently on the same target genes. This model not only implies existence of several levels of interaction but also provides a likely explanation for the strong ethylene response defects observed in auxin mutants.


Figures

Figure 1.
Figure 1.
Auxin Mutants Display Root-Specific Ethylene Insensitivity. (A) Relative organ size of 3-d-old etiolated seedlings grown in the presence of 0, 0.2, 0.5, and 10 μM ACC (ethylene precursor). The following genotypes were examined: Col-0 (wild type), ein2-5, ein3-1, eil1-1, wei2-1, aux1-7, eir1, axr1-12, and tir1-101. All of the mutants tested are in the Col-0 background. The response of each genotype to ethylene was expressed as the percentage of the organ length at a particular concentration of ACC with respect to the average length of that organ in the absence of the ethylene precursor. In the bottom panel, images of representative 3-d-old etiolated seedlings grown in the absence (−) or in the presence (+) of 10 μM ACC are displayed. Genotypes are as indicated. (B) Relative organ size of 3-d-old etiolated seedlings grown in the presence of 0, 0.02, 0.1, and 1 μM IAA (auxin). The following genotypes were examined: Col-0 (wild type), ein2-5, ein3-1, eil1-1, tir1-101, and aux1-7. All of the mutants tested are in the Col-0 background. The response of each genotype to auxin was expressed as the percentage of the organ length at a particular concentration of IAA with respect to the average length of that organ in the absence of auxin. In the bottom panel, images of representative 3-d-old etiolated seedlings grown in the absence (−) or in the presence (+) of 0.1 μM IAA are displayed. Genotypes are as indicated. An asterisk indicates a P value < 0.0001 (analysis of variance).
Figure 2.
Figure 2.
Expression of DR5:GUS in Root Transition Zones Correlates with Total Root Length. (A) Expression patterns of the DR5:GUS auxin reporter in roots of 3-d-old etiolated Col-0 and aux1-7 seedlings grown in the absence (air) or presence (ACC) of 10 μM ACC. GUS staining was performed overnight. Imaging conditions were identical for all of the plants in the experiment. The images displayed are representative of at least three independent experiments with >20 seedlings examined per experiment. (B) Expression patterns of the DR5:GUS auxin reporter in 3-d-old etiolated Col-0 seedlings grown in the presence of 10 μM ACC and rty1-1 seedlings grown in the absence of ACC. The top panel depicts three representative seedlings per genotype/treatment, while the bottom panel shows enlarged images of corresponding root tips. The images displayed are representative of two independent experiments.
Figure 3.
Figure 3.
Expression Pattern of the Ethylene Reporter EBS:GUS Is Altered in the aux1 Mutant Plants. Activity of the EBS:GUS ethylene reporter in roots of 3-d-old etiolated seedlings grown in media not supplemented (air) or supplemented (ACC) with 10 μM ACC. Transgenic lines carrying the EBS:GUS construct were originally generated in Col-0 plants and then introgressed into aux1-7 by crossing. Two representative lines in both Col and aux1-7 backgrounds are shown. GUS staining was performed overnight. Imaging conditions were identical for all of the plants in the experiment. The images displayed are representative of at least three independent experiments with >20 seedlings examined per experiment.
Figure 4.
Figure 4.
Ethylene and Auxin Alter Gene Expression in Both Hormone-Dependent and Hormone-Independent Ways. (A) Venn diagram showing the number of genes regulated by ethylene and auxin in roots of wild-type Col-0 plants and the overlap between these two groups of genes. (B) Graphic representation of the percentages of genes that had an altered response to ethylene and/or auxin in the aux1 and/or ein2 mutant backgrounds compared with that in the wild type. Pie diagrams, from left to right, display the percentages of ethylene-regulated genes that had an altered response to this hormone in the aux1 mutant plants, percentages of genes regulated by both ethylene and auxin that had an altered response to ethylene in aux1 mutant plants, percentages of genes regulated by both ethylene and auxin that had an altered response to auxin in the ein2 mutant plants, and percentage of auxin-regulated genes that had an altered response to this hormone in the ein2 mutant plants.
Figure 5.
Figure 5.
The Different Levels of Interactions Observed in the Microarray Experiments Are Confirmed by Quantitative RT-PCR. Relative expression levels of 12 selected genes (one or two per gene category) are shown. Graphs display the average and se of the normalized expression levels obtained in the microarray experiments (dots connected by lines) or in quantitative RT-PCR (solid bars). The microarray experiments and the quantitative RT-PCR were performed using RNA from independent biological replicates. The genes tested and their corresponding interaction categories (ETaux1N, ETaux1A, etc.) are as indicated. The genotypes and treatments are displayed on the horizontal axes of the bottom panels.
Figure 6.
Figure 6.
Gene Functional Analysis Supports the Existence of Hormone-Specific Effects and the Effects Mediated by the Interaction between Ethylene and Auxin. Several gene function categories were found to be significantly enriched in one of the ethylene- and/or auxin-regulated gene groups. The MapMan software and the corresponding gene function databases were used to determine the significance of the enrichment and the number of observed and expected genes in each functional group (see Methods for more details). ** and * indicate a P value < 0.0001 (with the * marking functional categories containing ≤3 genes). (A) Comparison between the number of genes (observed versus expected) in the following functional categories of auxin-regulated genes: C3H (C3H zing finger family of transcription factors), EREBP (AP2/EREBP family of transcription factors), IAA (AUX/IAA gene family), AS2 (family of transcription factors related to AS2), ethylene (genes annotated as ethylene related or ethylene metabolism), auxin (genes annotated as auxin related or auxin metabolism), propan. (genes annotated as secondary metabolism, phenylpropanoids), flavon. (genes annotated as secondary metabolism, flavonols), and cell wall (cell wall metabolism genes). (B) Comparison between the numbers of observed and expected genes in the same functional categories as in (A) but among ethylene-regulated genes. (C) Comparison between the number of observed and expected genes in the following functional categories of ethylene- and auxin-regulated genes: IAA (AUX/IAA gene family), auxin (auxin-related or auxin metabolism-related genes), and cell wall (cell wall metabolism genes).
Figure 7.
Figure 7.
Schematic Representation of the Mechanistic Model of Ethylene–Auxin Crosstalk in Roots of Etiolated Arabidopsis Seedlings. (A) The model assumes existence of at least three different types of molecular interactions between ethylene and auxin. A subset of ethylene responses (left side of the panel) is dependent on auxin levels (ETaux1A). In this case, the role of auxin is restricted to promoting (or attenuating) the ethylene effect. By contrast, the auxin-mediated responses (ET&IAAaux1A) correspond to those changes in gene expression that are directly triggered by auxin, but in this case, by an ethylene-induced auxin activity. Finally, those ethylene effects that are not affected by the levels of auxin are classified as auxin independent, with some of these changes being independently stimulated by auxin (ET&IAAaux1N). Equivalent interactions can be defined among auxin responses (right side of the panel). (B) The molecular interactions postulated above can be integrated with the morphological and cellular observations in a spatial/temporal model of the ethylene responses. From left to right, the time progression of the effects of ethylene on the levels of auxin activity (shown in blue), auxin biosynthetic genes (depicted as black dots), and auxin-dependent ethylene responses (marked in red) is indicated. At time 0 (before starting the ethylene treatment), the levels of auxin activity are low (shown in light blue) and are concentrated in the root zone 1. When ethylene is applied, the levels of WEI2/ASA1/TIR7, WEI7/ASB1, and potentially other biosynthetic genes (shown as black dots) increase, and the activity of auxin in zone 1 goes up. Next, the auxin activity in zone 2 becomes elevated, presumably through an AUX1-dependent transport activity from zone 1. This boost in auxin levels leads to changes in growth pattern of the cells in zone 3 from longitudinal to radial and to stimulation of ethylene responses in zone 3. Each root shown in this model is divided into two parts, with the left side of the root representing untreated roots, and the right side depicting ethylene-treated roots. Arrows in zone 3 of the roots indicate the longitudinal and radial components of root elongation. Zones 1, 2, and 3 are defined according to Birnbaum et al. (2003).

Similar articles

Cited by

References

    1. Abel, S., Nguyen, M.D., Chow, W., and Theologis, A. (1995). ACS4, a primary indole acetic acid-responsive gene encoding 1-aminocyclopropane-1-carboxylate synthase in Arabidopsis thaliana. Structural characterization, expression in Escherichia coli, and expression characteristics in response to auxin. J. Biol. Chem. 270 19093–19099. Erratum. J. Biol. Chem. 270: 26020. - PubMed
    1. Alonso, J.M., and Ecker, J.R. (2001). The ethylene pathway: A paradigm for plant hormone signaling and interaction. Sci. STKE 2001 RE1. - PubMed
    1. Alonso, J.M., and Stepanova, A.N. (2004). The ethylene signaling pathway. Science 306 1513–1515. - PubMed
    1. Alonso, J.M., et al. (2003. b). Genome-wide insertional mutagenesis of Arabidopsis thaliana. Science 301 653–657. - PubMed
    1. Alonso, J.M., Stepanova, A.N., Solano, R., Wisman, E., Ferrari, S., Ausubel, F.M., and Ecker, J.R. (2003. a). Five components of the ethylene-response pathway identified in a screen for weak ethylene-insensitive mutants in Arabidopsis. Proc. Natl. Acad. Sci. USA 100 2992–2997. - PMC - PubMed

Publication types

MeSH terms

Associated data