. 2007 Jul;19(7):2099-110.
doi: 10.1105/tpc.107.050641. Epub 2007 Jul 13.

Natural variation among Arabidopsis thaliana accessions for transcriptome response to exogenous salicylic acid

Affiliations

Natural variation among Arabidopsis thaliana accessions for transcriptome response to exogenous salicylic acid

Hans van Leeuwen et al. Plant Cell. 2007 Jul.

Abstract

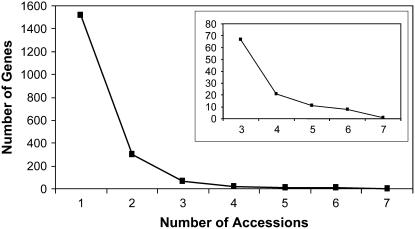
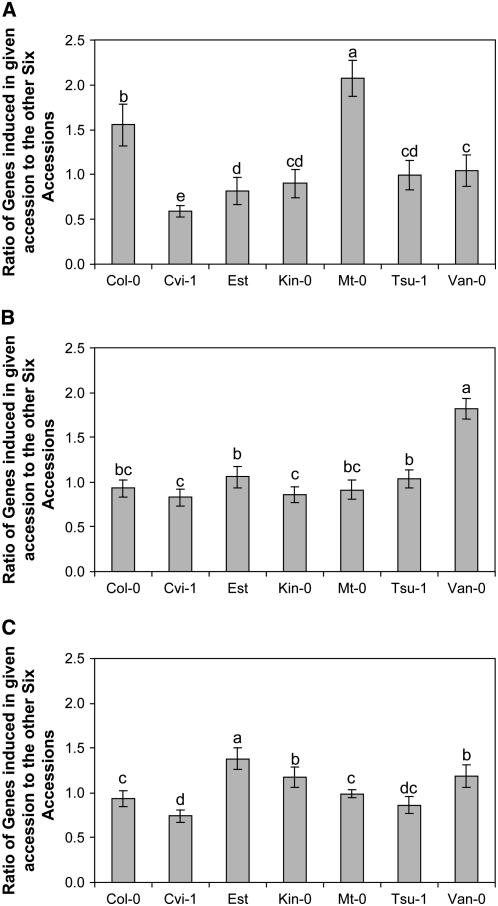
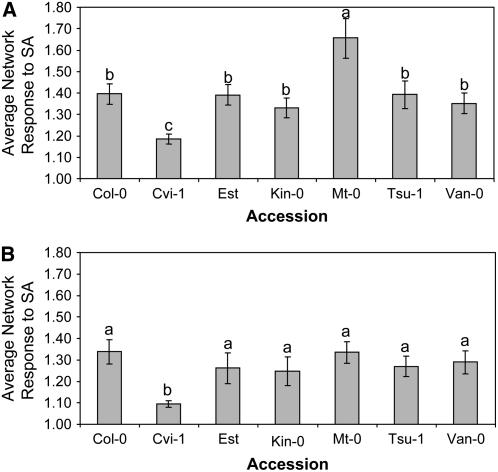
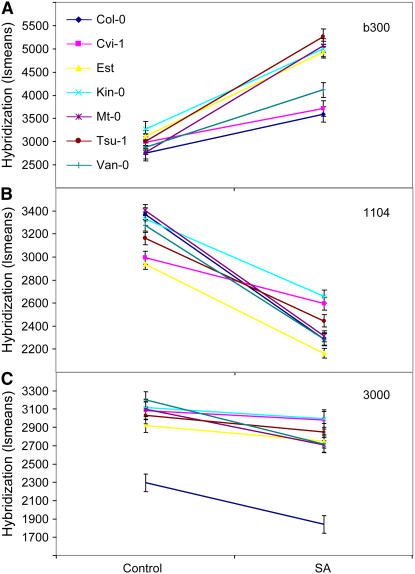
Little is known about how gene expression variation within a given species controls phenotypic variation under different treatments or environments. Here, we surveyed the transcriptome response of seven diverse Arabidopsis thaliana accessions in response to two treatments: the presence and absence of exogenously applied salicylic acid (SA), an important signaling molecule in plant defense. A factorial experiment was conducted with three biological replicates per accession with and without applications of SA and sampled at three time points posttreatment. Transcript level data from Affymetrix ATH1 microarrays were analyzed on both per-gene and gene-network levels to detect expression level polymorphisms associated with SA response. Significant variation in transcript levels for response to SA was detected among the accessions, with relatively few genes responding similarly across all accessions and time points. Twenty-five of 54 defined gene networks identified from other microarray studies (pathogen-challenged Columbia [Col-0]) showed a significant response to SA in one or more accessions. A comparison of gene-network relationships in our data to the pathogen-challenged Col-0 data demonstrated a higher-order conservation of linkages between defense response gene networks. Cvi-1 and Mt-0 appeared to have globally different SA responsiveness in comparison to the other five accessions. Expression level polymorphisms for SA response were abundant at both individual gene and gene-network levels in the seven accessions, suggesting that natural variation for SA response is prevalent in Arabidopsis.


Figures

Figure 1.
Figure 1.
Variation in Gene Response to SA Treatment in Seven Accessions. All genes that responded significantly to SA treatment at any time point (4, 28, and 52 hpt) were classified with respect to the number of accessions for which they showed a statistically significant response to SA treatment. The inset shows detail for the genes that responded in three to seven accessions.
Figure 2.
Figure 2.
Hypo- and Hyperresponses to SA Treatment as Measured by Individual Genes. The number of genes responding to SA in each of the accessions (as detected in the six pairwise analyses) was divided by the number of genes responding in the other accession in the pairwise analysis. Each analysis was conducted independently at each of three time points posttreatment. t tests were used to test for statistically significant differences in the ratio of SA-responsive genes between the seven accessions. Bars represent se. Different letters represent statistically different groupings at P = 0.05. (A) 4 hpt. (B) 28 hpt. (C) 52 hpt.
Figure 3.
Figure 3.
Hypo- and Hyperresponses to SA as Measured by Gene-Network Variation. The 25 SA-responsive networks were classified as either up- or downregulated, and the two groups were analyzed separately. For each accession, the average network expression value was obtained for each network from both the control and SA treatments. Only the 4-hpt time point was used. For each accession, the average response of the SA-upregulated networks (A) or SA-downregulated networks (B), respectively, was determined by dividing the mean network expression value under SA by its mean expression value under control conditions. The average value across all networks is presented. t tests were used to detect significant differences between the means; different letters represent statistically different groupings at P = 0.05. Bars represent se.
Figure 4.
Figure 4.
Gene-Network Expression Response to SA Treatment in Seven Accessions. The average gene-network expression value under control and SA treatments at 4 hpt for the seven accessions is presented for three example gene networks. Bars represent se. (A) Variable SA-mediated upregulation in network b300. (B) Variable SA-mediated downregulation in network 1104. (C) Gene network 3000 for which Col-0 is significantly different from the other accessions.
Figure 5.
Figure 5.
Variable Gene-Network Expression Responses in Pairwise Comparisons of Six Accessions with Col-0. To investigate relationships between gene networks that showed variation in the pairwise ANOVAs, we used the LCF multidimensional gene-network relationship shown in Supplemental Figure 4D online as a framework for comparison of Col-0 to the other six accessions. We included only those networks that were induced by SA. For each pair of accessions, the gene networks with statistically significant variation are indicated as black, gray, or hatched nodes. Black and gray nodes indicate gene networks with differential expression between the two accessions after SA or control treatments, respectively. Hatched black/gray nodes indicate those networks with differential expression between the two accessions under both treatment conditions. Black lines connect nodes showing variable expression. Nodes for gene networks that were not significantly different are in white and connected by gray lines. The statistical identification of pairwise network differences is shown in Supplemental Figure 5 online.

References

    1. Batagelj, V., and Mrvar, A. (2002). Pajek - Analysis and visualization of large networks. Graph Drawing Notes in Computer Science 2265 477–478.
    1. Benjamini, Y., and Hochberg, Y. (1995). Controlling the false discovery rate - A practical and powerful approach to multiple testing. J. R. Stat. Soc. Series B 57 289–300.
    1. Berardini, T., et al. (2004). Functional annotation of the Arabidopsis genome using controlled vocabularies. Plant Physiol. 135 1–11. - PMC - PubMed
    1. Borevitz, J.O., Liang, D., Plouffe, D., Chang, H.S., Zhu, T., Weigel, D., Berry, C.C., Winzeler, E., and Chory, J. (2003). Large-scale identification of single-feature polymorphisms in complex genomes. Genome Res. 13 513–523. - PMC - PubMed
    1. Brem, R.B., Yvert, G., Clinton, R., and Kruglyak, L. (2002). Genetic dissection of transcriptional regulation in budding yeast. Science 296 752–755. - PubMed

Publication types

LinkOut - more resources