. 2007 Dec;37(6):706-19.
doi: 10.1165/rcmb.2007-0199OC. Epub 2007 Jul 13.

Diesel-enriched particulate matter functionally activates human dendritic cells

Affiliations

Diesel-enriched particulate matter functionally activates human dendritic cells

Michael Porter et al. Am J Respir Cell Mol Biol. 2007 Dec.

Abstract

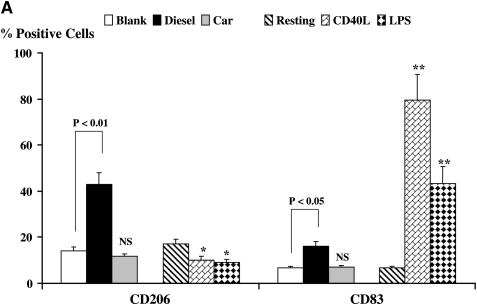
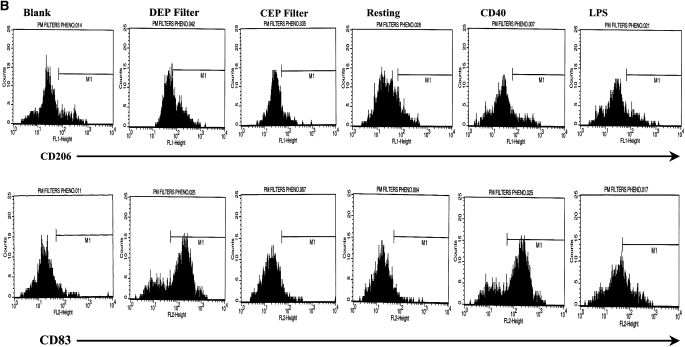
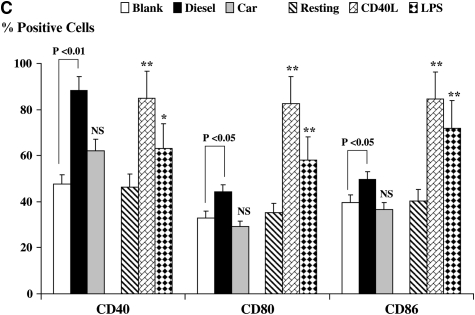
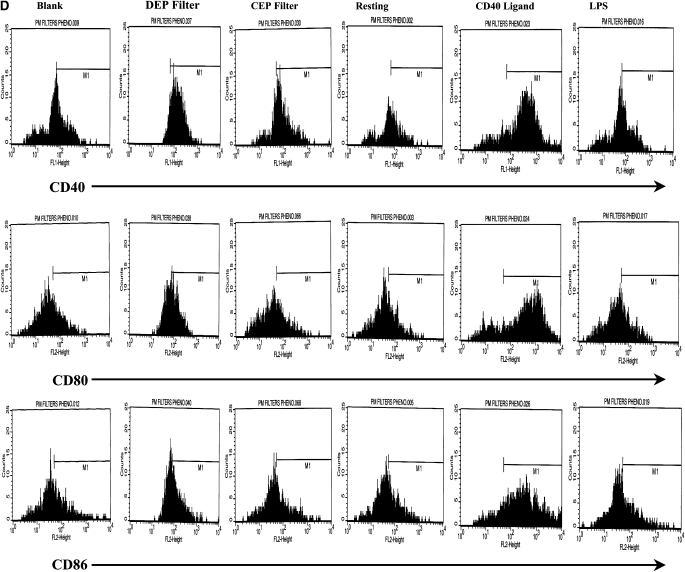
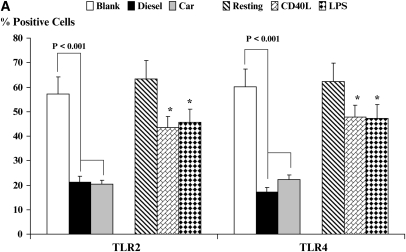
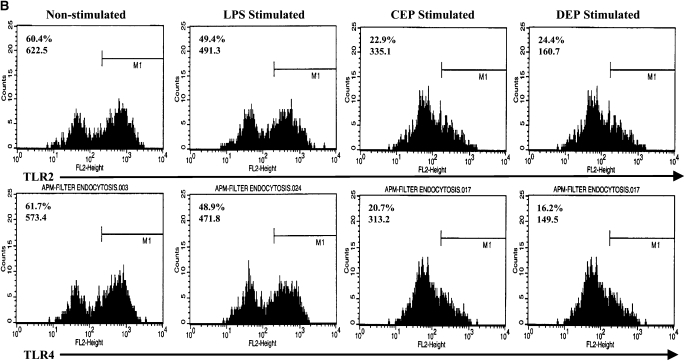
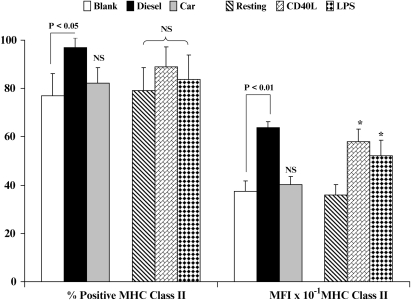
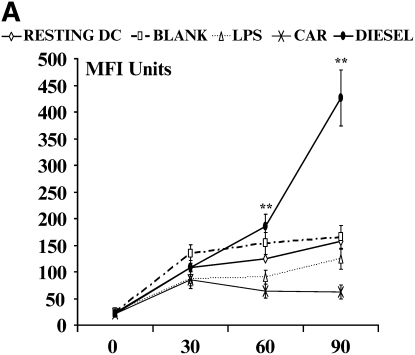
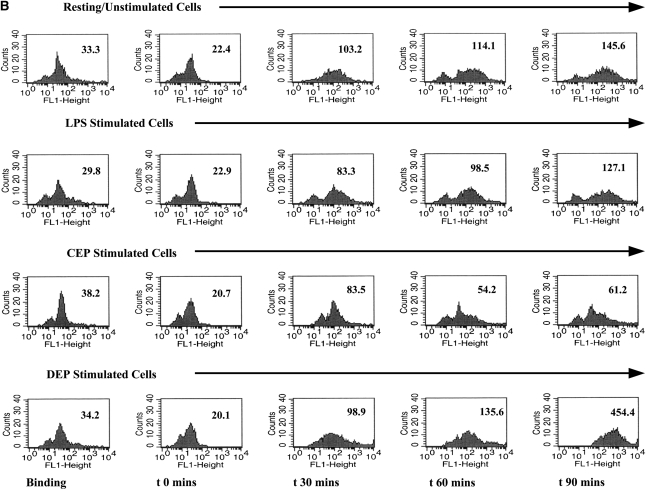
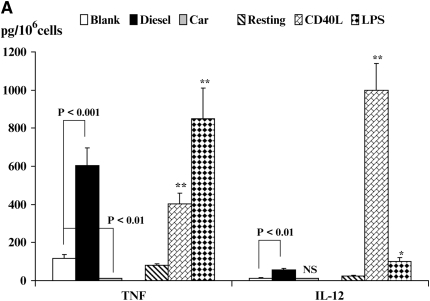
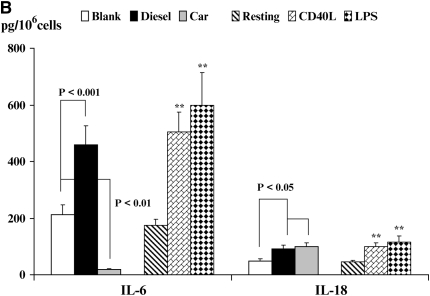
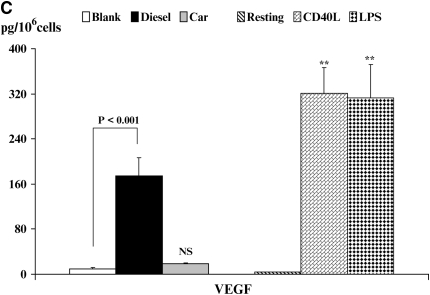
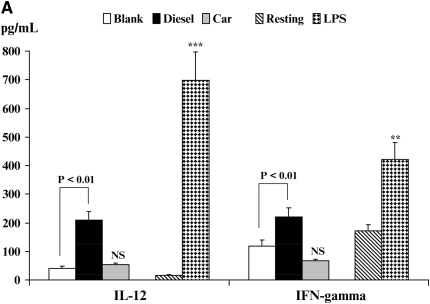
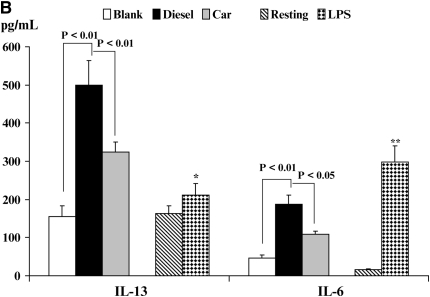
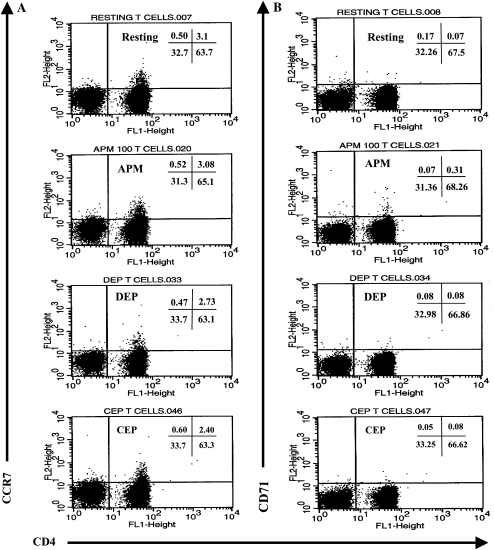
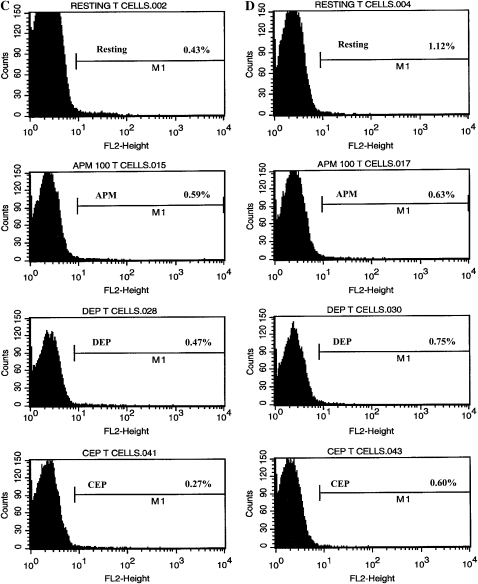
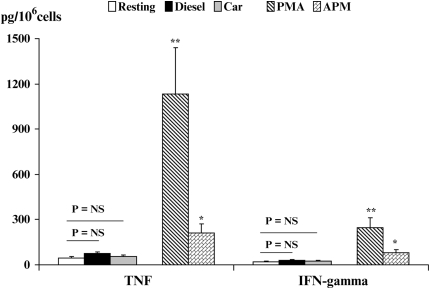
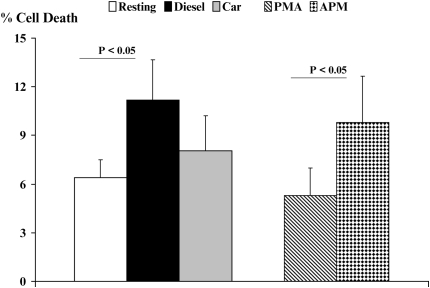
Epidemiologic studies have associated exposure to airborne particulate matter (PM) with exacerbations of asthma. It is unknown how different sources of PM affect innate immunity. We sought to determine how car- and diesel exhaust-derived PM affects dendritic cell (DC) activation. DC development was modeled using CD34+ hematopoietic progenitors. Airborne PM was collected from exhaust plenums of Fort McHenry Tunnel providing car-enriched particles (CEP) and diesel-enriched particles (DEP). DC were stimulated for 48 hours with CEP, DEP, CD40-ligand, or lipopolysaccharide. DC activation was assessed by flow cytometry, enzyme-linked immunosorbent assay, and standard culture techniques. DEP increased uptake of fluorescein isothiocyanate-dextran (a model antigen) by DC. Diesel particles enhanced cell-surface expression of co-stimulatory molecules (e.g., CD40 [P < 0.01] and MHC class II [P < 0.01]). By contrast, CEP poorly affected antigen uptake and expression of cell surface molecules, and did not greatly affect cytokine secretion by DC. However, DEP increased production of TNF, IL-6, and IFN-gamma (P < 0.01), IL-12 (P < 0.05), and vascular endothelial growth factor (P < 0.001). In co-stimulation assays of PM-exposed DC and alloreactive CD4+ T cells, both CEP and DEP directed a Th2-like pattern of cytokine production (e.g., enhanced IL-13 and IL-18 and suppressed IFN-gamma production). CD4+ T cells were not functionally activated on exposure to either DEP or CEP. Car- and diesel-enriched particles exert a differential effect on DC activation. Our data support the hypothesis that DEP (and to a lesser extent CEP) regulate important functional aspects of human DC, supporting an adjuvant role for this material.


Figures

<b>Figure 1.</b>
Figure 1.
Flow cytometric quantitation of the macrophage-mannose (endocytosis) receptor CD206 and CD83 (A) expression and flow cytometric histograms of this data from a representative experiment (B) on the cell surface of DC. Also shown is the expression of the co-stimulatory molecules CD40, CD80, and CD86 (C) and flow cytometric histograms of this data from a representative experiment (D.) Data for these series of experiments is recorded as % positive cells ± SD. The levels of significance between car-enriched particulate matter (CEP)- and diesel-enriched particulate matter (DEP)-treated dendritic cells (DC) are shown in the figure. *P < 0.05 and **P < 0.01 indicates differences between CD40L- or lipopolysaccharide (LPS)-treated DC as compared with resting DC. NS, not statistically significant.
<b>Figure 2.</b>
Figure 2.
Flow cytometric quantitation of the cell-surface expression of the pattern-recognition receptors TLR2 and TLR4 for resting and stimulated DC (A). Data are recorded as % positive cells ± SD. Levels of significance between CEP- and DEP-treated DC are shown in the figure. *P < 0.05 indicates differences between CD40L- or LPS-treated DC compared with resting DC. A series of flow histograms from one experiment is shown (B). Data are recorded as % positive cells and geometric mean fluorescence intensity.
<b>Figure 3.</b>
Figure 3.
Flow cytometric quantitation of MHC class II expression. Data on the left show % positive cells, data to the right show geometric mean fluorescence intensity (MFI) ± SD for resting and stimulated DC. Levels of significance between CEP- and DEP-treated DC are shown; *P < 0.05 indicates differences between resting and CD40L- or LPS-treated DC. NS, not statistically significant.
<b>Figure 4.</b>
Figure 4.
Flow cytometric quantitation of the time-dependent functional uptake of FITC-dextran by DC. Data are recorded as geometric mean fluorescence intensity units from n = 6 separate experiments. (A) This assay measures total shift (increases) in fluorescence intensity and not the percent of positive cells. Thus, with enhanced uptake of FITC-dextran there is an associated increase in geometric MFI. A series of flow histograms demonstrating the alterations in fluorescence intensity from one experiment is shown (B). Data described in the individual flow histograms are geometric MFI.
<b>Figure 5.</b>
Figure 5.
Quantitation of cytokine secretion by DC. Production of TNF-α and IL-12p40 (A), IL-6 and IL-18 (B), or VEGF (C) is shown. Data are recorded as pg/million cells ± SEM. The levels of significance between CEP- and DEP-treated DC are shown. *P < 0.05 and **P < 0.01 indicates differences between CD40L- or LPS-treated DC compared with resting DC. NS, not statistically significant.
<b>Figure 6.</b>
Figure 6.
Quantitation of immunoreactive cytokine secretion from DC/CD4+ allogeneic T cell co-cultures by enzyme-linked immunosorbent assay. The secretion of IL-12p70 and IFN-γ (A) and IL-13 and IL-6 (B) is shown. Data are recorded as pg/ml ± SEM. Levels of significance are *P < 0.05, **P < 0.01, and ***P < 0.001 as compared with resting DC. NS, not statistically significant.
<b>Figure 7.</b>
Figure 7.
Flow cytometric determination of cell-surface expression of the chemokine receptor and activation marker CCR7 (A), the transferring receptor CD71 (B), the β2-integrin CD11b (C), and MHC class II/HLA-DR (D) on activation of CD4+ T cells by CEP or DEP. Neither CEP nor DEP significantly altered the cell surface expression of any of these markers by normal human CD4+ T cells. Data described in the flow cytometric dot plots and histograms are defined as % positive cells and/or geometric MFI as shown.
<b>Figure 8.</b>
Figure 8.
Determination of the effects of CEP or DEP in promoting either TNF (A) or IFN-γ (B) secretion by CD4+ T cells as compared with IL-2 and PMA co-stimulated CD4+ T cells. Data are described as pg of cytokine produced per million CD4+ T cells. CEP and DEP were without effect and did not promote any cytokine production by normal human CD4+ T cells.
<b>Figure 9.</b>
Figure 9.
Quantitation of percent cell viability by exclusion of the vital dye trypan blue by viable CD4+ T cells by brightfield light microscopy. Human CD4+ T cells were exposed to CEP or DEP for 18 hours and the percentage of cells that were nonviable was determined.

Similar articles

Cited by

References

    1. Laden F, Schwartz J, Speizer FE, Dockery DW. Reduction in fine particulate air pollution and mortality: extended follow-up of the Harvard Six Cities Study. Am J Respir Crit Care Med 2006;173:667–672. - PMC - PubMed
    1. Dominici F, McDermott A, Daniels M, Zeger SL, Samet JM. Revised analyses of the National Morbidity, Mortality, and Air Pollution Study: mortality among residents of 90 cities. J Toxicol Environ Health A 2005;68:1071–1092. - PubMed
    1. Ryan PH, LeMasters G, Biagini J, Bernstein D, Grinshpun SA, Shukla R, Wilson K, Villareal M, Burkle J, Lockey J. Is it traffic type, volume, or distance? Wheezing in infants living near truck and bus traffic. J Allergy Clin Immunol 2005;116:279–284. - PubMed
    1. Nel AE, Diaz-Sanchez D, Ng D, Hiura T, Saxon A. Enhancement of allergic inflammation by the interaction of between diesel exhaust particles and the immune system. J Allergy Clin Immunol 1998;102:539–554. - PubMed
    1. Riedl M, Diaz-Sanchez D. Biology of diesel exhaust effects on respiratory function. J Allergy Clin Immunol 2005;115:221–228. - PubMed

Publication types

MeSH terms