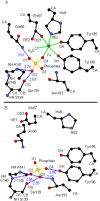
Sulfate as a synergistic anion facilitating iron binding by the bacterial transferrin FbpA: the origins and effects of anion promiscuity
- PMID: 17630737
- PMCID: PMC3674819
- DOI: 10.1021/ja0709268
Sulfate as a synergistic anion facilitating iron binding by the bacterial transferrin FbpA: the origins and effects of anion promiscuity
Abstract
The ferric binding protein, FbpA, has been demonstrated to facilitate the transport of naked Fe3+ across the periplasmic space of several Gram-negative bacteria. The sequestration of iron by FbpA is facilitated by the presence of a synergistic anion, such as phosphate or sulfate. Here we report the sequestration of Fe3+ by FbpA in the presence of sulfate, at an assumed periplasmic pH of 6.5 to form FeFbpA-SO4 with K'(eff) = 1.7 x 10(16) M(-1) (at 20 degrees C, 50 mM MES, 200 mM KCl). The iron affinity of the FeFbpA-SO4 protein assembly is 2 orders of magnitude lower than when bound with phosphate and is the lowest of any of the FeFbpA-X assemblies yet reported. Iron reduction at the cytosolic membrane receptor may be an essential aspect of the periplasmic iron-transport process, and with an E(1/2) of -158 mV (NHE), FeFbpA-SO4 is the most easily reduced of all FeFbpA-X assemblies yet studied. The variation of FeFbpA-X assembly stability (K'(eff)) and ease of reduction (E(1/2)) with differing synergistic anions X(n-) are correlated over a range of 14 kJ, suggesting that the variations in redox potentials are due to stabilization of Fe3+ in FeFbpA-X by X(n-). Anion promiscuity of FbpA in the diverse composition of the periplasmic space is illustrated by the ex vivo exchange kinetics of FeFbpA-SO4 with phosphate and arsenate, where first-order kinetics with respect to FeFbpA-SO4 (k = 30 s(-1)) are observed at pH 6.5, independent of entering anion concentration and identity. Anion lability and influence on the iron affinity and reduction potential for FeFbpA-X support the hypothesis that synergistic anion exchange may be an important regulator in iron delivery to the cytosol. This structural and thermodynamic analysis of anion binding in FeFbpA-X provides additional insight into anion promiscuity and importance.
Figures


Similar articles
-
Kinetics and mechanism of exogenous anion exchange in FeFbpA-NTA: significance of periplasmic anion lability and anion binding activity of ferric binding protein A.J Biol Inorg Chem. 2010 Feb;15(2):237-48. doi: 10.1007/s00775-009-0589-2. Epub 2009 Oct 8. J Biol Inorg Chem. 2010. PMID: 19813031
-
Ex vivo analysis of synergistic anion binding to FbpA in Gram-negative bacteria.Biochemistry. 2008 Apr 8;47(14):4298-305. doi: 10.1021/bi701188x. Epub 2008 Mar 14. Biochemistry. 2008. PMID: 18338854
-
Kinetics of iron release from ferric binding protein (FbpA): mechanistic implications in bacterial periplasm-to-cytosol Fe3+ transport.Biochemistry. 2005 Jul 19;44(28):9606-18. doi: 10.1021/bi0505518. Biochemistry. 2005. PMID: 16008346
-
FbpA--a bacterial transferrin with more to offer.Biochim Biophys Acta. 2012 Mar;1820(3):379-92. doi: 10.1016/j.bbagen.2011.09.001. Epub 2011 Sep 10. Biochim Biophys Acta. 2012. PMID: 21933698 Review.
-
Computational approaches for deciphering the equilibrium and kinetic properties of iron transport proteins.Metallomics. 2017 Nov 15;9(11):1513-1533. doi: 10.1039/c7mt00216e. Metallomics. 2017. PMID: 28967944 Review.
Cited by
-
Perturbation-response scanning reveals ligand entry-exit mechanisms of ferric binding protein.PLoS Comput Biol. 2009 Oct;5(10):e1000544. doi: 10.1371/journal.pcbi.1000544. Epub 2009 Oct 23. PLoS Comput Biol. 2009. PMID: 19851447 Free PMC article.
-
Monitoring lactoferrin iron levels by fluorescence resonance energy transfer: a combined chemical and computational study.J Biol Inorg Chem. 2014 Mar;19(3):439-47. doi: 10.1007/s00775-013-1088-z. Epub 2014 Jan 18. J Biol Inorg Chem. 2014. PMID: 24442915
-
Kinetics and mechanism of exogenous anion exchange in FeFbpA-NTA: significance of periplasmic anion lability and anion binding activity of ferric binding protein A.J Biol Inorg Chem. 2010 Feb;15(2):237-48. doi: 10.1007/s00775-009-0589-2. Epub 2009 Oct 8. J Biol Inorg Chem. 2010. PMID: 19813031
-
Ga3+ as a mechanistic probe in Fe3+ transport: characterization of Ga3+ interaction with FbpA.J Biol Inorg Chem. 2008 Aug;13(6):887-98. doi: 10.1007/s00775-008-0376-5. Epub 2008 May 7. J Biol Inorg Chem. 2008. PMID: 18461372
-
Microbial iron acquisition: marine and terrestrial siderophores.Chem Rev. 2009 Oct;109(10):4580-95. doi: 10.1021/cr9002787. Chem Rev. 2009. PMID: 19772347 Free PMC article. Review. No abstract available.
References
-
- Crichton RR. Inorganic Biochemistry of Iron Metabolism: From Molecular Mechanism to Clinical Consequences. 2nd ed. Wiley; New York: 2001.
-
- Crosa JH, Mey AR, Payne SM. Iron Transport in Bacteria. ASM Press; Washington D.C.: 2004.
-
- Mietzner TA, Tencza SB, Adhikari P, Vaughan KG, Nowalk AJ. In: Current Topics Microbiology and Immunology. Vogt PK, Mahan MJ, editors. Vol. 225. Springer; Berlin: 1998. pp. 113–35. - PubMed
-
- Sritharan M. World J. Microbiol. Biotechnol. 2000;16:769–80.
-
- Clarke TE, Tari LW, Vogel HJ. Curr. Top. Med. Chem. 2001;1:7–30. - PubMed
Publication types
MeSH terms
Substances
Grants and funding
LinkOut - more resources
Full Text Sources
Medical
Molecular Biology Databases
Miscellaneous

