. 2007 Jul;3(7):e115.
doi: 10.1371/journal.pcbi.0030115.

Sarcomere lattice geometry influences cooperative myosin binding in muscle

Affiliations

Sarcomere lattice geometry influences cooperative myosin binding in muscle

Bertrand C W Tanner et al. PLoS Comput Biol. 2007 Jul.

Abstract

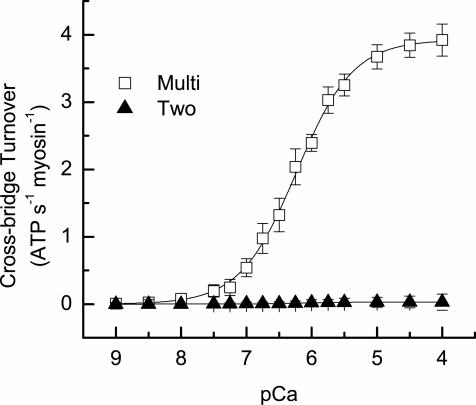
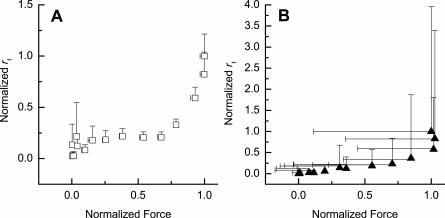
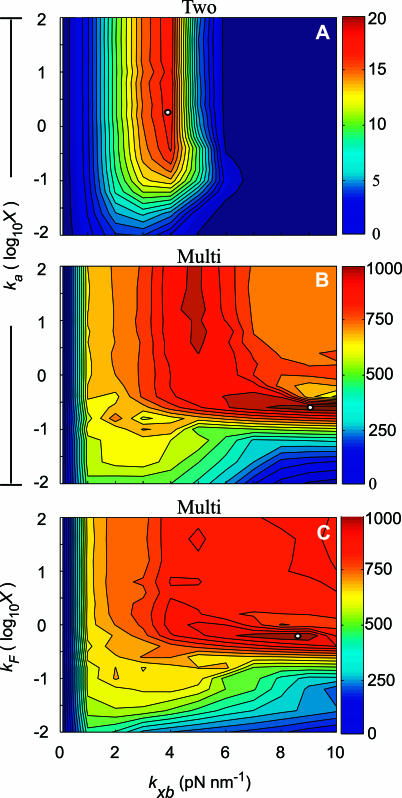
In muscle, force emerges from myosin binding with actin (forming a cross-bridge). This actomyosin binding depends upon myofilament geometry, kinetics of thin-filament Ca(2+) activation, and kinetics of cross-bridge cycling. Binding occurs within a compliant network of protein filaments where there is mechanical coupling between myosins along the thick-filament backbone and between actin monomers along the thin filament. Such mechanical coupling precludes using ordinary differential equation models when examining the effects of lattice geometry, kinetics, or compliance on force production. This study uses two stochastically driven, spatially explicit models to predict levels of cross-bridge binding, force, thin-filament Ca(2+) activation, and ATP utilization. One model incorporates the 2-to-1 ratio of thin to thick filaments of vertebrate striated muscle (multi-filament model), while the other comprises only one thick and one thin filament (two-filament model). Simulations comparing these models show that the multi-filament predictions of force, fractional cross-bridge binding, and cross-bridge turnover are more consistent with published experimental values. Furthermore, the values predicted by the multi-filament model are greater than those values predicted by the two-filament model. These increases are larger than the relative increase of potential inter-filament interactions in the multi-filament model versus the two-filament model. This amplification of coordinated cross-bridge binding and cycling indicates a mechanism of cooperativity that depends on sarcomere lattice geometry, specifically the ratio and arrangement of myofilaments.


Conflict of interest statement

Competing interests. The authors have declared that no competing interests exist.

Figures

Figure 1
Figure 1. Multi-Filament Geometry
The multi-filament model comprises four thick and eight thin filaments. (A) A cross-sectional representation of model geometry shows thick filaments in red and thin filaments in blue. Toroidal boundary conditions (outlined by the dotted white square) reflect the behavior at each edge onto the opposite edge of the simulation space. This condition permits simulating a subsection of infinite lattice space without any edge effects. (B) A truncated side view represents a single thick filament with two co-linear facing thin filaments in the plane of the page. Myosin extends from the central body of the thick filament. Thin filaments show each actin strand in a different shade of blue, with white actin monomers representing the actin nodes in the model. The proteins troponin (yellow) and tropomyosin (green) are located along each actin strand to provide Ca2+-sensitive regulation of actin and myosin binding.
Figure 2
Figure 2. Filament Mechanical Interactions
Mechanics are simulated using a network of linear springs, with tunable spring constants km, ka, and kxb for the thick filament, thin filament, and myosin cross-bridge. mj through mj +1 are thick-filament nodes, with actin nodes ai −1 through ai +1 and ak through ak +1 along opposing thin filaments. We show only those cross-bridge spring elements extending from mj to illustrate a co-linear plane of filament interactions; all other cross-bridges lie outside of this plane. Thus, binding between mj and ai occurs when: 1) ai is activated by Ca2+ to bind with myosin, 2) the cross-bridge is in the proper rotational plane, and 3) both nodes are close enough to permit a reasonable probability of cross-bridge binding.
Figure 3
Figure 3. Kinetic Scheme
Model kinetic structure (using the same color scheme as Figure 1) shows coupled, three-state cycles for thin-filament activation and cross-bridge formation. Thin-filament states TF1, TF2, and TF3, represent no Ca2+ bound to troponin, Ca2+ bound to troponin, and Ca2+ bound to troponin plus a movement of tropomyosin that exposes myosin binding sites on actin, respectively. TF1 and TF2 represent thin-filament conformations where myosin cannot bind to actin. Cross-bridge states XB1, XB2, and XB3 represent unbound, bound pre-powerstroke, and bound post-powerstroke actomyosin conformations, respectively. Cross-bridge conformations associated with XB2 and XB3 bear force. We list a possible biochemical condition associated with each cross-bridge state using A, M, D, and P to represent actin, myosin, ADP, and inorganic phosphate (Pi). A ∼ M signifies the unbound state (XB1), and A . M represents actomyosin binding (XB2 and XB3). While transition rates between cross-bridge states (rx,ij) depend on position and cross-bridge distortion, the transition rates between thin-filament states (rt,ij) do not. Note that the transition between XB3 and XB1 is biochemically associated with a release of ADP, myosin binding another ATP, dissociation of myosin from actin, and hydrolysis of ATP into products ADP and Pi. Thin-filament transitions from TF3 to TF2 are not permitted while a cross-bridge is bound. Each cycle is thermodynamically balanced (Equations 7 and 14).
Figure 4
Figure 4. Transient Predictions
Temporal predictions of average relative force (A), fractional thin-filament nodes available to bind with myosin, fa (B), and fractional cross-bridge binding, fxb (C) for the multi-filament (black) and two-filament (green) models at pCa levels 4.0, 6.0, and 7.5 (pCa = −log10 [Ca2+]). The number of simulations trials averaged to generate each trace (Nruns or 24Nruns) is summarized in Table 3. Our standard mechanical parameters apply to these simulations: kxb = 5, ka = 5229, and km = 6060 pN nm−1.
Figure 5
Figure 5. Steady-State Predictions
Average force (A), fractional thin-filament activation, fa (B), fractional cross-bridge binding, fxb (C), and calculated force per bound myosin cross-bridge (D) from the multi-filament (open square) and two-filament (black triangle) models are plotted over the range of simulated [Ca2+]. Predictions are reported as mean ±SD, where single-sided error bars project downward for the multi-filament versus upward for the two-filament model. Error bars lie within the symbol when not visible. Mechanical parameters for kxb, ka, and km are the same as those outlined in the legend of Figure 4. In Figure 4A−4C, the solid lines represent least squares minimization of the data to a three-parameter Hill equation (Equation 22). Force-per-bound cross-bridge is not calculated for low [Ca2+] levels where extremely limited cross-bridge binding occurs. The solid lines in (D) are least squares fits to the data.
Figure 6
Figure 6. Steady-State Cross-Bridge Turnover
Average ATPase (one ATP per cross-bridge cycle) for the multi-filament (open square) and two-filament (black triangle) model is plotted against pCa. Predictions are shown as mean ±SD. When error bars are not visible, they reside within the symbol. Mechanical parameters for kxb, ka, and km are the same as those listed in the legend of Figure 4. Solid lines represent least squares minimization of ATP consumption to a three-parameter Hill equation (Equation 22).
Figure 7
Figure 7. Rate of Force Generation (rf)
Average rf plotted against normalized force, for the multi-filament (A, open square) and two-filament (B, black triangle) models, is calculated from a single, increasing exponential function ([17], and Methods section). Predictions are shown as mean ±SD, using single-sided error bars along each axis. Error bars that are not visible lie within the symbol. Note the difference in scale on the ordinates.
Figure 8
Figure 8. Maximal Force Varies with Lattice Stiffness
Contour plots of average steady-state force at maximal Ca2+ activation (pCa 4) across a range of mechanical lattice parameters are shown for the two-filament (A) and multi-filament (B,C) models. All simulation predictions adjust kxb over a range of [0.1–10] pN nm−1, shown on the abscissa of each panel. Simulations adjusting ka and kxb, while keeping km fixed at 6,060 pN nm−1 were done for both models (A,B). These simulations adjusted ka over a four-decade range (with respect to the original value of ka) using a scalar multiplier, X, that ranged from [−2 to 2] in log10 space, represented on the ordinate of (A) and (B). (C), however, is a different type of simulation performed only with the multi-filament model. This second type of simulation simultaneously scales the stiffness of both thick and thin filaments (kF) from their original values, using a similar range of X as (A) and (B). Colored-scale bars for force in pN are shown to the right of each panel; note the difference in scale between the two-filament predictions (A) and the multi-filament predictions (B,C). The maximum contour value (white solid circle) is 16, 963, and 933 pN for (A–C).
Figure 9
Figure 9. Steady-State Predictions Vary with Lattice Stiffness and [Ca2+]
Contour plots of average steady-state predictions from the multi-filament model for force (A–F), fractional cross-bridge binding, fxb (G–L), and cross-bridge turnover (or ATP consumption, [M–R]) as a function of [Ca2+], kxb, and filament stiffness, kF (simultaneously scaling both thick- and thin-filament stiffness using X as in Figure 8C). Within each panel, values of pCa range from 9–4, while kF values are identical to those in Figure 8C. kxb increases from left to right across each column of panels as indicated (ranging from 1–15 pN nm−1). Contour levels are specified by the color bar at the far right of each row. Areas appearing brown indicate regions where steady-state values exceed the upper limit of the color bar. The solid white circle in each panel corresponds to the maximum contour level, not a single maximum point in pCa-log10 XkFkxb space. The maximum force contour for (A–F) is 683, 766, 897, 949, 885, and 940 pN. Maximal fractional binding is 0.24, 0.18, 0.17, 0.16, 0.14, and 0.13 for (G–L), and maximal ATP consumption is 14.4, 8.57, 6.81, 5.89, 4.58, and 3.74 ATP s−1 myosin−1 for (M–R).
Figure 10
Figure 10. Free Energy and Transition Rate Profiles
Position-dependent free energy differences (A) and transition rates (B–D) between cross-bridge states (see Figure 3) are shown for kxb = 5 pN nm−1. The coordinate along the abscissa of each panel, x, represents the position difference between a particular pair of actin and myosin nodes associated with cross-bridge formation (Equation 9). (A) Horizontal lines give free energies of detached states (XB1), with the difference between the two horizontal lines representing the standard free energy drop over a full cross-bridge cycle (ΔG(x), Equation 8). ΔG(x) is used to define the minimum in each parabolic free energy well G 2(x) and G 3(x) (representing bound states XB2 and XB3). (B–D) Solid lines are associated with corresponding forward transition rates, and dashed lines are associated with reverse transition rates (Figure 3, Equations 15–17). We define free energies and forward transition rates for each state, then use these to calculate reverse transition rates (Equation 14).

Similar articles

Cited by

References

    1. Huxley AF. Muscle structure and theories of contraction. Prog Biophys Biophys Chem. 1957;7:255–318. - PubMed
    1. Lymn RW, Taylor EW. Mechanism of adenosine triphosphate hydrolysis by actomyosin. Biochemistry. 1971;10:4617–4624. - PubMed
    1. Eisenberg E, Hill TL, Chen Y. Cross-bridge model of muscle contraction: Quantitative analysis. Biophys J. 1980;29:195–227. - PMC - PubMed
    1. Pate E, Cooke R. A model of crossbridge action: The effects of ATP, ADP, and Pi . J Muscle Res Cell Motil. 1989;10:181–196. - PubMed
    1. Tobacman LS. Thin filament-mediated regulation of cardiac contraction. Ann Rev Physiol. 1996;58:447–481. - PubMed

Publication types

MeSH terms