. 2007 Jul;3(7):e133.
doi: 10.1371/journal.pcbi.0030133.

Optimal timing and duration of induction therapy for HIV-1 infection

Affiliations

Optimal timing and duration of induction therapy for HIV-1 infection

Marcel E Curlin et al. PLoS Comput Biol. 2007 Jul.

Abstract

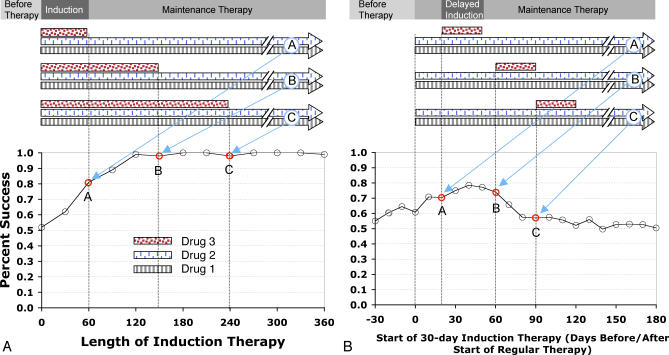
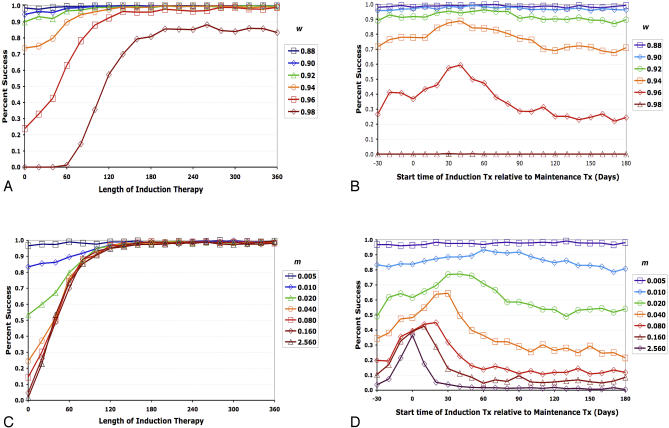
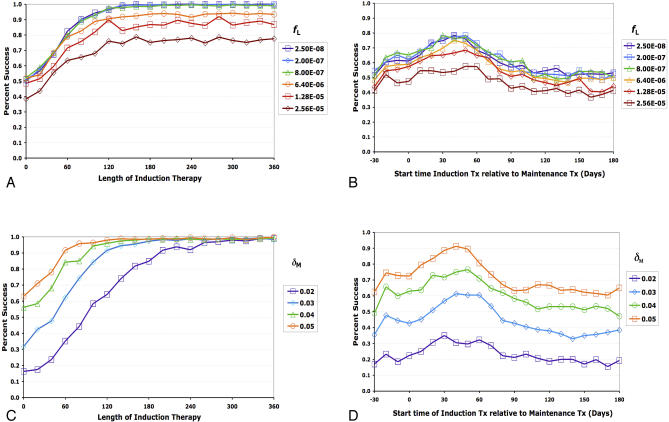
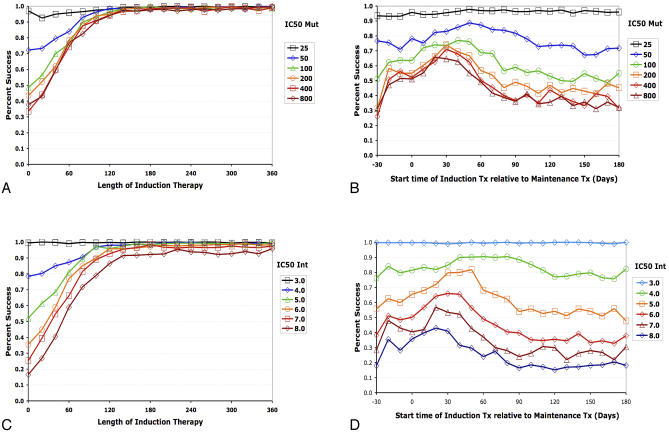
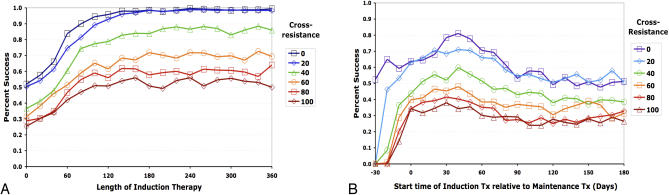
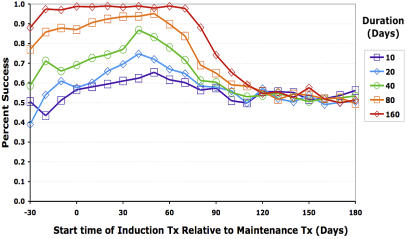
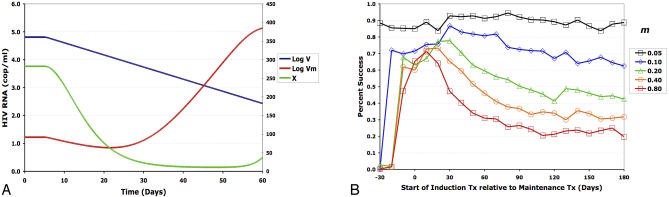
The tradeoff between the need to suppress drug-resistant viruses and the problem of treatment toxicity has led to the development of various drug-sparing HIV-1 treatment strategies. Here we use a stochastic simulation model for viral dynamics to investigate how the timing and duration of the induction phase of induction-maintenance therapies might be optimized. Our model suggests that under a variety of biologically plausible conditions, 6-10 mo of induction therapy are needed to achieve durable suppression and maximize the probability of eradicating viruses resistant to the maintenance regimen. For induction regimens of more limited duration, a delayed-induction or -intensification period initiated sometime after the start of maintenance therapy appears to be optimal. The optimal delay length depends on the fitness of resistant viruses and the rate at which target-cell populations recover after therapy is initiated. These observations have implications for both the timing and the kinds of drugs selected for induction-maintenance and therapy-intensification strategies.


Conflict of interest statement

Competing interests. The authors have declared that no competing interests exist.

Figures

Figure 1
Figure 1. Overview of Cell Populations (A) and Mutations Responsible for Resistance (B)
Mutation accumulation was modeled as a sequential process in which each genotype can acquire a single additional mutation in any given time-step (0.002 d in our simulations). In a single time step, V 1, for example, could mutate to V 12, V 13, or V 14, but not to V 123. The model also allows for recombinational steps (see text), which are not depicted here.
Figure 2
Figure 2. Simulations of Viral Dynamics
(A) Dynamics in the absence of therapy. (B) Decline in viral load during potent triple-drug combination therapy. Maintenance and inducer drugs are provided for 360 d starting on day 0. Dark blue line, target cells; black line, WT virus; blue-green lines, single mutants; orange lines, double mutants; red lines, triple mutants. Viral populations that are above the threshold for stochastic effects (dark gray line) may fluctuate if the corresponding infected cell populations are below the cutoff for stochastic effects. After the initiation of therapy, WT virus declines with appropriate first-, second-, and third-order kinetics. Viruses with a single mutation decline to near steady-state levels above the extinction threshold. Viruses with two resistance mutations approach the extinction threshold, but are not entirely eliminated by day 300. Triple mutants are generally extinct by day 40.
Figure 3
Figure 3. Schematic Illustrating Treatment Strategies Investigated in This Study
(A) Effect of progressively longer induction regimens (circles A–C) on the likelihood of successfully eradicating viruses resistant to maintenance therapy under our canonical parameter set. (B) Effect of altering the timing of induction therapy (circles A–C) relative to maintenance therapy on the likelihood of successful therapy. x-Axis indicates duration of induction therapy in days (A), or interval between start of the induction and maintenance therapies, in days (B). Maintenance therapy is assumed to start on day 0. y-Axis indicates percentage of simulations in which viral load remained undetectable for at least 3 y after ending induction therapy.
Figure 4
Figure 4. Deterministic Model of the Dynamics of Resistant Viruses under the One-Drug, One-Mutant, One-Cell Version of Our Target-Cell Model
(A) Slow turnover rates for CD4+ target cells (m = 0.02, k = 0.0005). (B) Rapid turnover rates for CD4+ target cells (m = 0.32, k = 0.008). Here m and k were increased proportionately so as to isolate the effect of changing turnover rate without altering pre-therapy viral load. Blue lines, WT virus; red lines, drug-resistant virus; green lines, target cells. These simulations assume a high cost of resistance (w 1 = k 1/k = 0.6). Other parameters are as in Table 2 assuming a single population of short-lived infected cells. Interpretation: these simulations illustrate previous theoretical studies showing the concentration of drug-resistant viruses declines transiently following the initiation of therapy.
Figure 5
Figure 5. Computer Simulations Demonstrating Success Rates in Eradicating Viruses Resistant to Maintenance Therapy as a Function of Fitness Costs of Resistance and Turnover Rates of Target Cells
(A,B) Effects of fitness (w) of resistant viruses in the absence of drug. (C,D) Effect of target-cell death rates (m) (modeled here with simultaneous increases in k in order to keep pre-therapy viral load the same in each simulation). (A) and (C) demonstrate success rates as the duration of induction therapy is increased, and (B) and (D) demonstrate success rates over a range of induction therapy start times. x-Axis indicates duration of induction therapy in days (A,C), or the interval between the start of a 30-d induction period and maintenance therapy in days (B,D). Maintenance therapy is assumed to start on day 0. y-Axis indicates percentage of simulations in which viral load remained undetectable for at least 3 y after ending induction therapy. Data in each panel were based on 500 replicate simulations. Interpretation: delaying induction therapy until after the start of maintenance therapy results in higher success rates. Under these conditions, starting a 30-d induction period after the start of maintenance therapy usually optimized the probably of success. Success rates decline as the fitness cost of resistance mutations decreases (w approaches 1) and as target-cell turnover rates (m) increase. The latter effect occurs because target cells necessary for the return of resistant virus rebound more rapidly after therapy at higher turnover rates.
Figure 6
Figure 6. Computer Simulations Showing Relationships Between Long-Lived Infected Cells and Treatment Success Rates
(A,B) Effect of proportion of infected cells becoming latently infected quiescent memory T lymphocytes (modeled here by changing f L). (C,D) Effect of varying the death rate of moderately long-lived infected cells, δ M (modeled here with simultaneous increases in f M in order to keep the pre-therapy density of moderately long-lived cells the same in each simulation). (A) and (C) demonstrate success rates as the duration of induction therapy is increased, and (B) and (D) demonstrate success rates over a range of induction therapy start times. x-Axis indicates duration of induction therapy in days (A,C), or the interval between the start of a 30-d induction period and maintenance therapy in days (B,D). Maintenance therapy is assumed to start on day 0. y-Axis indicates percentage of simulations in which viral load remained undetectable for at least 3 y after ending induction therapy. Data in each panel were based on 400 simulations. Interpretation: the death rate of moderately long-lived infected cells is a major determinant of how long induction therapy should last. At expected rates of f L (rate at which infected target cells transition to quiescent memory T lymphocytes), success rates depend little on rebound from the latent reservoir. However, success rates decline as the rate of virus input into the latent reservoir exceeds ∼6.4 × 10⁻⁶ per infected cell, indicating that rebound of resistant virus from the latent reservoir becomes a significant factor.
Figure 7
Figure 7. Simulations Demonstrating the Effects of Varying the Degree of Resistance on Treatment Success Rates
As in Figures 5 and 6, (A) and (C) demonstrate success rates as the duration of induction therapy is increased, and (B) and (D) demonstrate success rates over a range of induction therapy/therapy intensification start times. IC50INT quantifies the degree of resistance that either mutation 1 or mutation 2 confers to drug I. IC50MUT quantifies both the degree of resistance that mutation 3 confers to drug II and the degree of resistance that mutation 4 confers to drug III. x-Axis indicates duration of induction therapy in days (A,C), or interval between start of a 30-d induction therapy and maintenance therapy, in days (B,D). Maintenance therapy is assumed to start on day 0. y-Axis indicates percentage of simulations in which viral load remained undetectable for at least 3 y after ending induction therapy. Data in each panel were based on 400 simulations. Interpretation: IM therapy success rates decrease with the degree of resistance conferred by these mutations.
Figure 8
Figure 8. Simulations Demonstrating the Effects of Cross-Resistance on Treatment Success Rates
As in Figures 5–7, (A) demonstrates success rates as the duration of induction therapy is increased, and (B) demonstrates success rates over a range of induction therapy/therapy intensification start times. The different lines quantify the degree of resistance that mutations 3 and 4 confer against drugs III and II, respectively. x-Axis indicates duration of induction therapy in days (A), or interval between start of a 30-d induction therapy and maintenance therapy, in days (B). Maintenance therapy is assumed to start on day 0. y-Axis indicates percentage of simulations in which viral load remained undetectable for at least 3 y after ending induction therapy. Data in each panel were based on 400 simulations. Interpretation: IM therapy success rates decrease with the degree of cross-resistance between mutations 3 and 4.
Figure 9
Figure 9. Relationship between Duration of Induction Therapy and Start Time of Induction Therapy Relative to Start of Maintenance Therapy
x-Axis indicates interval between start of induction and maintenance therapies, in days. Maintenance therapy is assumed to start on day 0. y-Axis indicates percentage of simulations in which viral load remained undetectable for at least 3 y after ending induction therapy. Interpretation: the success of IM therapy increases with increasing duration of induction therapy. Delaying the start of induction therapy until ∼40 d after the start of maintenance therapy may be optimal, and the effect of timing is most pronounced with induction therapies lasting 0.5–2 mo. Longer and shorter induction periods are less sensitive to the effects of timing. There is little benefit to adding a delayed-induction therapy at times beyond 90 d after the start of maintenance therapy.
Figure 10
Figure 10. Computer Simulations of Dynamics of Drug-Resistant Virus under Simple Immune-Control Model
(A) Immune-control analog of the one-cell, one-drug model presented in Figure 4. (B) Effect of changing turnover rate of immune effectors under the immune-control analog of the full model explored in Figures 5–9. In this simulation, the turnover rate of the immune effectors was modeled by simultaneously increasing s X, m X, and k X. Here, k = 0.00085, T = 1,000, μ = 6 × 10⁻⁴, and w 1 = w 2 = w 3 = w 4 = 0.9. Other parameters are as in Table 2. Interpretation: changing the factor responsible for controlling viral load did not change the conclusion that drug resistant viruses will decrease transient after drug therapy. As with the target-cell limited model, the rate at which the factor that controlled viral load changed after therapy played a major role in determining when therapy should be intensified.

Similar articles

Cited by

References

    1. Yeni PG, Hammer SM, Hirsch MS, Saag MS, Schechter M, et al. Treatment for adult HIV infection: 2004 recommendations of the International AIDS Society—USA Panel. JAMA. 2004;292:251–265. - PubMed
    1. Saag MS. Initiation of antiretroviral therapy: Implications of recent findings. Top HIV Med. 2004;12:83–88. - PubMed
    1. Raguin G, Chene G, Morand-Joubert L, Taburet AM, Droz C, et al. Salvage therapy with amprenavir, lopinavir and ritonavir 200 mg/d or 400 mg/d in HIV-infected patients in virological failure. Antivir Ther. 2004;9:615–625. - PubMed
    1. Murphy MD, Marousek GI, Chou S. HIV protease mutations associated with amprenavir resistance during salvage therapy: Importance of I54M. J Clin Virol. 2004;30:62–67. - PubMed
    1. Fournier S, Chaffaut C, Maillard A, Loze B, Lascoux C, et al. Factors associated with virological response in HIV-infected patients failing antiretroviral therapy: A prospective cohort study. HIV Med. 2005;6:129–134. - PubMed

Publication types

MeSH terms

Substances