

A first-principles model of early evolution: emergence of gene families, species, and preferred protein folds
- PMID: 17630830
- PMCID: PMC1914367
- DOI: 10.1371/journal.pcbi.0030139
A first-principles model of early evolution: emergence of gene families, species, and preferred protein folds
Abstract
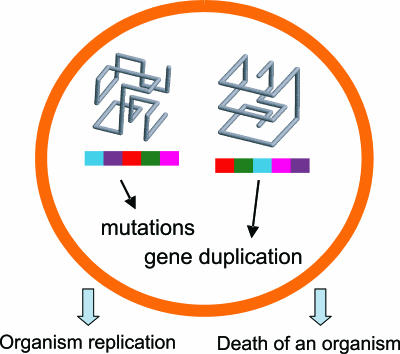
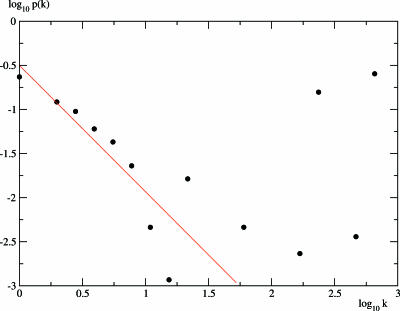
In this work we develop a microscopic physical model of early evolution where phenotype--organism life expectancy--is directly related to genotype--the stability of its proteins in their native conformations-which can be determined exactly in the model. Simulating the model on a computer, we consistently observe the "Big Bang" scenario whereby exponential population growth ensues as soon as favorable sequence-structure combinations (precursors of stable proteins) are discovered. Upon that, random diversity of the structural space abruptly collapses into a small set of preferred proteins. We observe that protein folds remain stable and abundant in the population at timescales much greater than mutation or organism lifetime, and the distribution of the lifetimes of dominant folds in a population approximately follows a power law. The separation of evolutionary timescales between discovery of new folds and generation of new sequences gives rise to emergence of protein families and superfamilies whose sizes are power-law distributed, closely matching the same distributions for real proteins. On the population level we observe emergence of species--subpopulations that carry similar genomes. Further, we present a simple theory that relates stability of evolving proteins to the sizes of emerging genomes. Together, these results provide a microscopic first-principles picture of how first-gene families developed in the course of early evolution.
Conflict of interest statement
Figures


Similar articles
-
Protein family and fold occurrence in genomes: power-law behaviour and evolutionary model.J Mol Biol. 2001 Nov 2;313(4):673-81. doi: 10.1006/jmbi.2001.5079. J Mol Biol. 2001. PMID: 11697896
-
Physical origins of protein superfamilies.J Mol Biol. 2006 Apr 7;357(4):1335-43. doi: 10.1016/j.jmb.2006.01.081. Epub 2006 Feb 6. J Mol Biol. 2006. PMID: 16483605
-
Exploring dynamics of protein structure determination and homology-based prediction to estimate the number of superfamilies and folds.BMC Struct Biol. 2006 Mar 20;6:6. doi: 10.1186/1472-6807-6-6. BMC Struct Biol. 2006. PMID: 16549009 Free PMC article.
-
The structure of the protein universe and genome evolution.Nature. 2002 Nov 14;420(6912):218-23. doi: 10.1038/nature01256. Nature. 2002. PMID: 12432406 Review.
-
The birth-and-death evolution of multigene families revisited.Genome Dyn. 2012;7:170-96. doi: 10.1159/000337119. Epub 2012 Jun 25. Genome Dyn. 2012. PMID: 22759819 Review.
Cited by
-
From quantum-derived principles underlying cysteine reactivity to combating the COVID-19 pandemic.Wiley Interdiscip Rev Comput Mol Sci. 2022 Sep-Oct;12(5):e1607. doi: 10.1002/wcms.1607. Epub 2022 Mar 5. Wiley Interdiscip Rev Comput Mol Sci. 2022. PMID: 35600063 Free PMC article.
-
Evolutionary capacitance and control of protein stability in protein-protein interaction networks.PLoS Comput Biol. 2013 Apr;9(4):e1003023. doi: 10.1371/journal.pcbi.1003023. Epub 2013 Apr 4. PLoS Comput Biol. 2013. PMID: 23592969 Free PMC article.
-
Topology of protein interaction network shapes protein abundances and strengths of their functional and nonspecific interactions.Proc Natl Acad Sci U S A. 2011 Mar 8;108(10):4258-63. doi: 10.1073/pnas.1009392108. Epub 2011 Feb 22. Proc Natl Acad Sci U S A. 2011. PMID: 21368118 Free PMC article.
-
The birth-death-mutation process: a new paradigm for fat tailed distributions.PLoS One. 2011;6(11):e26480. doi: 10.1371/journal.pone.0026480. Epub 2011 Nov 1. PLoS One. 2011. PMID: 22069453 Free PMC article.
-
Merging molecular mechanism and evolution: theory and computation at the interface of biophysics and evolutionary population genetics.Curr Opin Struct Biol. 2014 Jun;26:84-91. doi: 10.1016/j.sbi.2014.05.005. Epub 2014 Jun 19. Curr Opin Struct Biol. 2014. PMID: 24952216 Free PMC article. Review.
References
-
- Chothia C. Proteins. One thousand families for the molecular biologist. Nature. 1992;357:543–544. - PubMed
-
- Huynen MA, van Nimwegen E. The frequency distribution of gene family sizes in complete genomes. Mol Biol Evol. 1998;15:583–589. - PubMed
-
- Orengo CA, Jones DT, Thornton JM. Protein superfamilies and domain superfolds. Nature. 1994;372:631–634. - PubMed
-
- Qian J, Luscombe NM, Gerstein M. Protein family and fold occurrence in genomes: Power-law behaviour and evolutionary model. J Mol Biol. 2001;313:673–681. - PubMed
Publication types
MeSH terms
Substances
LinkOut - more resources
Full Text Sources
