Characterization of AgMaT2, a plasma membrane mannitol transporter from celery, expressed in phloem cells, including phloem parenchyma cells
- PMID: 17631523
- PMCID: PMC1976583
- DOI: 10.1104/pp.107.103143
Characterization of AgMaT2, a plasma membrane mannitol transporter from celery, expressed in phloem cells, including phloem parenchyma cells
Abstract
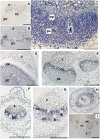
A second mannitol transporter, AgMaT2, was identified in celery (Apium graveolens L. var. dulce), a species that synthesizes and transports mannitol. This transporter was successfully expressed in two different heterologous expression systems: baker's yeast (Saccharomyces cerevisiae) cells and tobacco (Nicotiana tabacum) plants (a non-mannitol-producing species). Data indicated that AgMaT2 works as an H(+)/mannitol cotransporter with a weak selectivity toward other polyol molecules. When expressed in tobacco, AgMaT2 decreased the sensitivity to the mannitol-secreting pathogenic fungi Alternaria longipes, suggesting a role for polyol transporters in defense mechanisms. In celery, in situ hybridization showed that AgMaT2 was expressed in the phloem of leaflets, petioles from young and mature leaves, floral stems, and roots. In the phloem of petioles and leaflets, AgMaT2, as localized with specific antibodies, was present in the plasma membrane of three ontologically related cell types: sieve elements, companion cells, and phloem parenchyma cells. These new data are discussed in relation to the physiological role of AgMaT2 in regulating mannitol fluxes in celery petioles.
Figures


Similar articles
-
Identification of a mannitol transporter, AgMaT1, in celery phloem.Plant Cell. 2001 Mar;13(3):695-705. doi: 10.1105/tpc.13.3.695. Plant Cell. 2001. PMID: 11251106 Free PMC article.
-
The promoters of 3 celery salt-induced phloem-specific genes as new tools for monitoring salt stress responses.Plant Physiol Biochem. 2011 Jan;49(1):2-8. doi: 10.1016/j.plaphy.2010.09.008. Epub 2010 Oct 25. Plant Physiol Biochem. 2011. PMID: 20980156
-
The sucrose transporter of celery. Identification and expression during salt stress.Plant Physiol. 2000 Apr;122(4):1447-55. doi: 10.1104/pp.122.4.1447. Plant Physiol. 2000. PMID: 10759540 Free PMC article.
-
Understanding and manipulating sucrose phloem loading, unloading, metabolism, and signalling to enhance crop yield and food security.J Exp Bot. 2014 Apr;65(7):1713-35. doi: 10.1093/jxb/ert416. Epub 2013 Dec 17. J Exp Bot. 2014. PMID: 24347463 Review.
-
The plant axis as the command centre for (re)distribution of sucrose and amino acids.J Plant Physiol. 2021 Oct;265:153488. doi: 10.1016/j.jplph.2021.153488. Epub 2021 Aug 4. J Plant Physiol. 2021. PMID: 34416599 Review.
Cited by
-
Lost in Transit: Long-Distance Trafficking and Phloem Unloading of Protein Signals in Arabidopsis Homografts.Plant Cell. 2016 Sep;28(9):2016-2025. doi: 10.1105/tpc.16.00249. Epub 2016 Sep 6. Plant Cell. 2016. PMID: 27600534 Free PMC article.
-
Yield, Growth, Quality, Biochemical Characteristics and Elemental Composition of Plant Parts of Celery Leafy, Stalk and Root Types Grown in the Northern Hemisphere.Plants (Basel). 2020 Apr 9;9(4):484. doi: 10.3390/plants9040484. Plants (Basel). 2020. PMID: 32283805 Free PMC article.
-
Heterogeneity in the expression and subcellular localization of POLYOL/MONOSACCHARIDE TRANSPORTER genes in Lotus japonicus.PLoS One. 2017 Sep 20;12(9):e0185269. doi: 10.1371/journal.pone.0185269. eCollection 2017. PLoS One. 2017. PMID: 28931056 Free PMC article.
-
Glycans as Modulators of Plant Defense Against Filamentous Pathogens.Front Plant Sci. 2018 Jul 4;9:928. doi: 10.3389/fpls.2018.00928. eCollection 2018. Front Plant Sci. 2018. PMID: 30022987 Free PMC article. Review.
-
Micro-Evolution Analysis Reveals Diverged Patterns of Polyol Transporters in Seven Gramineae Crops.Front Genet. 2020 Jun 19;11:565. doi: 10.3389/fgene.2020.00565. eCollection 2020. Front Genet. 2020. PMID: 32636871 Free PMC article.
References
-
- Amiard V, Demming-Adams B, Mueh KE, Turgeon R, Combs AF, Adams WW III (2007) Role of light and jasmonic acid signaling in regulating foliar phloem cell wall ingrowth development. New Phytol 173 722–731 - PubMed
-
- Atanassova R, Favet N, Martz F, Chabbert B, Tollier MT, Monties B, Legrand M, Fritig B (1995) Altered lignin composition in transgenic tobacco expressing O-methyltransferase sequences in sense and antisense orientation. Plant J 8 465–477
-
- Carpaneto A, Geiger D, Bamberg E, Sauer N, Fromm J, Hedrich R (2005) Phloem-localized, proton-coupled sucrose carrier ZmSUT1 mediates sucrose efflux under the control of the sucrose gradient and the proton motive force. J Biol Chem 280 21437–21443 - PubMed
MeSH terms
Substances
Associated data
- Actions
- Actions
LinkOut - more resources
Full Text Sources
Other Literature Sources

