. 2007 Sep;145(1):147-59.
doi: 10.1104/pp.107.101691. Epub 2007 Jul 13.

Phosphate homeostasis and root development in Arabidopsis are synchronized by the zinc finger transcription factor ZAT6

Affiliations

Phosphate homeostasis and root development in Arabidopsis are synchronized by the zinc finger transcription factor ZAT6

Ballachanda N Devaiah et al. Plant Physiol. 2007 Sep.

Abstract

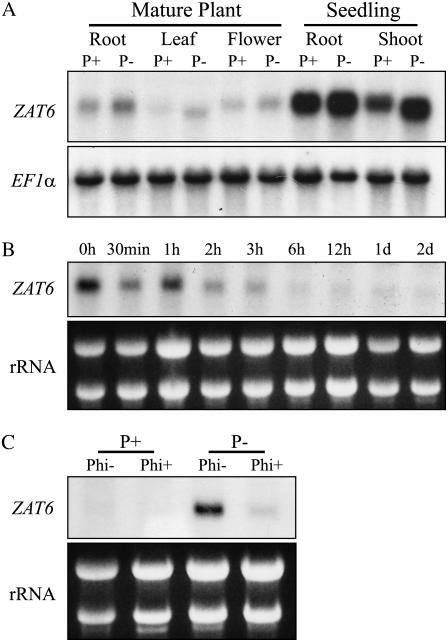
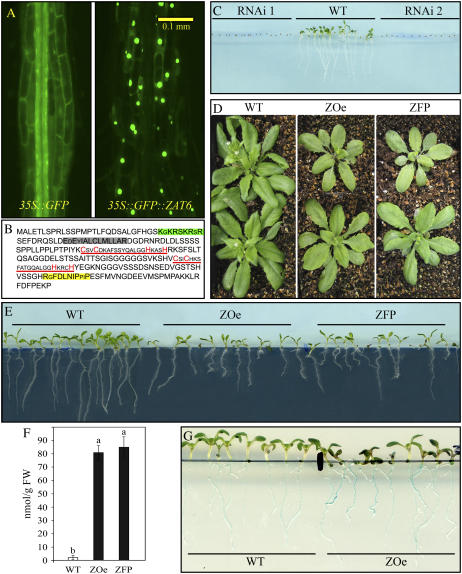
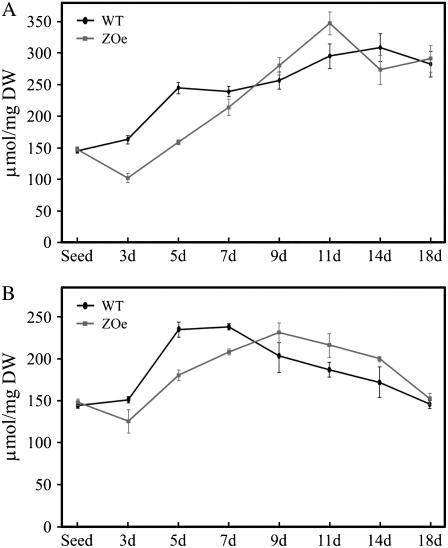
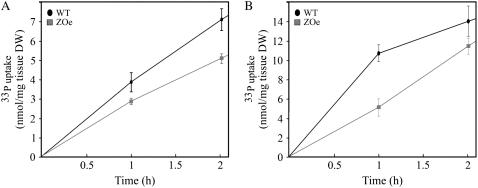
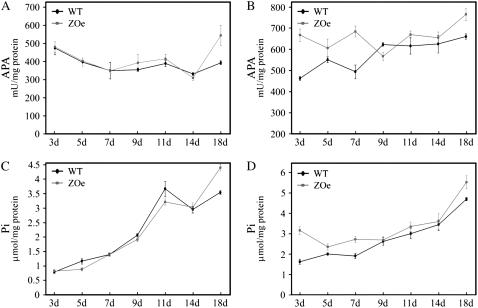
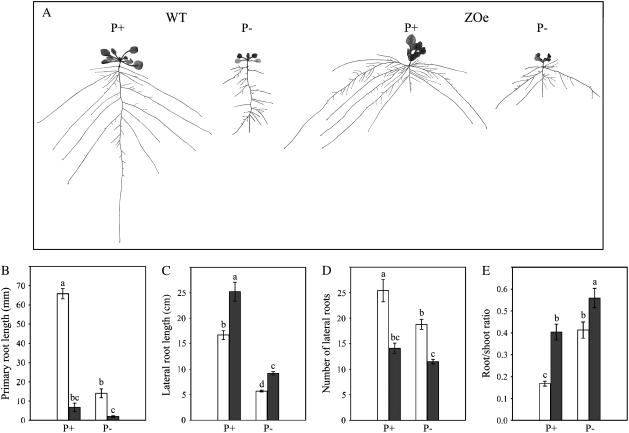
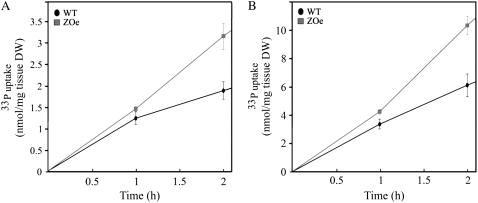
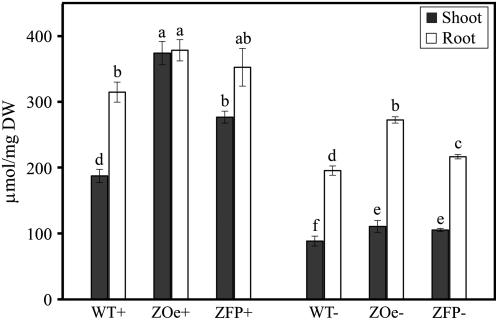
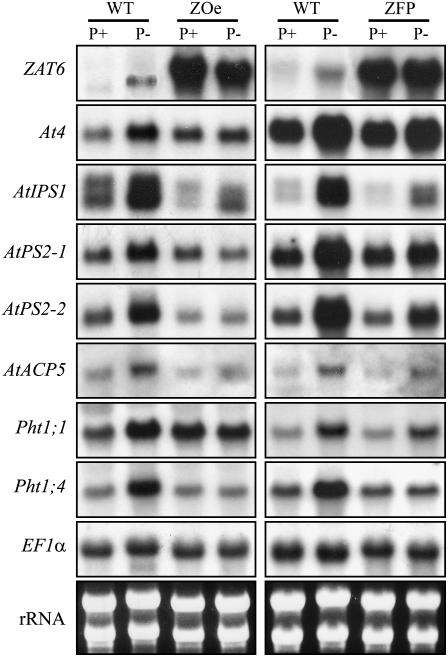
Phosphorus availability is limited in many natural ecosystems. Plants adapt to phosphate (Pi) deficiency by complex molecular processes. There is growing evidence suggesting that transcription factors are key components in the regulation of these processes. In this study, we characterized the function of ZAT6 (zinc finger of Arabidopsis 6), a cysteine-2/histidine-2 zinc finger transcription factor that is responsive to Pi stress. ZAT6 is induced during Pi starvation and localizes to the nucleus. While the RNAi suppression of ZAT6 appeared to be lethal, its overexpression affects root development and retards seedling growth as a result of decreased Pi acquisition. The ZAT6 overexpression also resulted in altered root architecture of older plants, with consequent changes in Pi acquisition. These results indicate that ZAT6 regulates root development independent of the Pi status of the plant, thereby influencing Pi acquisition and homeostasis. In addition, the expression of several Pi starvation-responsive genes was decreased in ZAT6 overexpressing plants, thereby confirming the role of ZAT6 in regulating Pi homeostasis. This study thus indicates that ZAT6 is a repressor of primary root growth and regulates Pi homeostasis through the control of root architecture. To our knowledge, ZAT6 is the first cysteine-2/histidine-2 zinc finger transcription factor reported to regulate root development and nutrient stress responses.


Figures

Figure 1.
Figure 1.
ZAT6 is responsive to Pi deprivation. A, RNA-blot analysis of ZAT6 gene expression. Arabidopsis plants were grown either hydroponically or in liquid culture conditions for 7 d and then transferred to medium containing Pi (P+) or lacking Pi (P−), where they were grown for an additional 7 d. Roots, rosette leaves, and flowers were collected from mature plants grown hydroponically while roots and shoots were collected from young seedlings grown in liquid culture. The expression of ZAT6 in these samples was detected through RNA-blot analysis as described below. An elongation factor (EF1α) gene probe was used as a loading control. B, Decrease in ZAT6 transcripts as Pi-deprived plants are replenished with Pi. Plants that were Pi deprived for 7 d were moved into P+ media. The expression of ZAT6 was monitored at 0 h, 30 m, 1, 2, 3, 6, 12 h, 1, and 2 d by collecting the plant tissue at these time points and using them for RNA-blot analysis. EtBr-stained ribosomal RNA prior to transfer is shown to indicate loading and integrity of the RNA. C, ZAT6 expression is suppressed by Phi, an analog of Pi, during Pi deprivation. Plants were grown in liquid culture conditions under P+ and P− regimes with or without 3 mm Phi for 7 d before they were harvested for RNA-blot analysis. EtBr-stained ribosomal RNA prior to transfer is shown to indicate loading and integrity of the RNA. For RNA-blot analysis 10 μg of total RNA from the samples was separated electrophoretically and blotted onto a nylon membrane that was then probed with a 32P-labeled ZAT6 cDNA.
Figure 2.
Figure 2.
Subcellular localization of ZAT6 and the effects of its altered expression. A, Nuclear localization of a GFP∷ZAT6 fusion protein. The sections show microscopic images of root cells from Arabidopsis plants transformed with a control gene 35SGFP (left section) or a 35SGFPZAT6 fusion gene (right section). These results were observed under both P+ and P− conditions. B, Deduced amino acid sequence of ZAT6. The nuclear localization signal represented by the B box is highlighted in green. The two highly conserved C2H2 zinc finger domains are denoted by red underlined letters. The L box and DLN box are highlighted in gray and yellow, respectively. C, Nongerminating seeds of two representative ZAT6 RNAi transgenic lines in comparison to wild-type (WT) seeds 7 d after sowing. D, Phenotype of ZOe and ZAT6∷GFP overexpressing (ZFP) plants relative to wild type (WT). Plants were germinated and grown on soil for 3 weeks. E, Comparative image of wild type (WT), ZOe, and ZAT6∷GFP overexpressing (ZFP) plants 5 dpg on 0.5× Murashige and Skoog medium. F, Increased anthocyanin content in young ZOe seedlings. Anthocyanin content was determined in wild type (WT), ZOe, and ZAT6∷GFP overexpressing (ZFP) plants 3 dpg. Values are mean ± se (n = 6) and different letters above the bars indicate that the means are statistically different (P < 0.05). G, In vivo APase staining of wild-type (WT) and ZOe roots 5 dpg. The dark blue-stained ZOe roots indicate increased APA.
Figure 3.
Figure 3.
Total Pi content is decreased in ZOe seedlings during early stages of development. Total Pi content was estimated in wild-type (WT) and ZOe seeds as well as shoots and roots of seedlings grown on 0.5× Murashige and Skoog medium at 3, 5, 7, 9, 11, 14, and 18 dpg. Black ovals represent wild type and gray squares represent ZOe. Error bars represent se (n = 3). A, Total Pi content in shoots. B, Total Pi content in roots.
Figure 4.
Figure 4.
Young ZOe seedlings have decreased Pi uptake. Pi uptake was monitored over a 2 h period in wild-type (WT; black ovals) and ZOe (gray squares) seedlings grown on 0.5× Murashige and Skoog medium 3 and 5 dpg. A, Pi uptake in seedlings 3 dpg. B, Pi uptake in seedlings 5 dpg. Error bars represent se (n = 3).
Figure 5.
Figure 5.
The APA and soluble Pi content in ZOe seedlings is tightly correlated. APA and soluble Pi content was estimated in shoots and roots of wild-type (WT) and ZOe seedlings grown on 0.5× Murashige and Skoog medium at 3, 5, 7, 9, 11, 14, and 18 dpg. Black ovals represent wild type and gray squares represent ZOe. Error bars represent se (n = 3). A, APA in shoots. B, APA in roots. C, Soluble Pi content in shoots. D, Soluble Pi content in roots.
Figure 6.
Figure 6.
ZAT6 overexpression alters root architecture. Wild-type (WT) and ZOe plants were grown under P+ and P− conditions for 7 d on vertically oriented petri plates. A, Lateral roots were spread to reveal the architectural details and scanned at 600 dpi. The seedlings shown are representative of 12 seedlings of the wild-type and ZOe plants grown under P+ and P− conditions. B to E show comparative histograms of wild type (white bars) and ZOe (black bars) with regard to various components of their root architecture under P+ or P− conditions. Different letters on the bars represent means that are statistically different (P < 0.05). Values are means ± se (n = 12) of each genotype per treatment. B, Primary root length. C, Length of first order lateral roots. D, Total number of lateral roots per plant. E, Root/shoot ratio.
Figure 7.
Figure 7.
Pi uptake is increased in older ZOe seedlings. Wild-type (WT; black ovals) and ZOe (gray squares) seedlings were grown on 0.5× Murashige and Skoog medium for 7 d and then transferred as groups of 10 seedlings into P+ or P− medium for 3 d. The Pi uptake of these 10-d-old seedlings was monitored over a 2 h period. A, Pi uptake in plants from P+ conditions. B, Pi uptake in plants from Pi-deficient conditions. Error bars represent se (n = 3).
Figure 8.
Figure 8.
Total Pi content is increased in 14-d-old ZOe seedlings. Wild-type (WT) and ZOe plants were grown on 0.5× Murashige and Skoog medium for 7 d and then transferred to P+ and P− medium for 7 d. Total Pi concentration in shoots (black bars) and roots (white bars) was estimated. Error bars indicate se (n = 3) and different letters above the bars represent means that are statistically different (P < 0.05).
Figure 9.
Figure 9.
Expression of Pi starvation-induced genes in plants overexpressing ZAT6. Seven-day-old wild-type (WT), ZOe, and 35SZAT6GFP expressing (ZFP) plants grown in liquid culture under P+ and P− conditions for 7 d were used for RNA extraction. Total RNA (10 μg) was electrophoretically separated, blotted onto a nylon membrane, and hybridized with a 32P-labeled ZAT6 probe. The membrane was stripped and subsequently rehybridized with probes corresponding to the following genes consecutively: At4, AtIPS1, AtPS2-1, AtPS2-2, AtACP5, Pht1;1, and Pht1;4. EF1α was used as the loading control. Ethidium bromide-stained rRNA prior to blotting demonstrates the RNA integrity.

References

    1. Abel S, Ticconi AC, Delatorre CA (2002) Phosphate sensing in higher plants. Physiol Plant 115 1–8 - PubMed
    1. Abramoff MD, Magelhaes PJ, Ram SJ (2004) Image processing with ImageJ. Biophotonics International 11 36–42
    1. Ascencio J (1994) Acid phosphatase as a diagnostic tool. Commun Soil Sci Plant Anal 25 1553–1564
    1. Baldwin JC, Karthikeyan AS, Raghothama KG (2001) LEPS2, a phosphorus starvation-induced novel acid phosphatase from tomato. Plant Physiol 125 728–737 - PMC - PubMed
    1. Bari R, Pant BD, Stitt M, Scheible W-R (2006) PHO2, microRNA399, and PHR1 define a phosphate-signaling pathway in plants. Plant Physiol 141 988–999 - PMC - PubMed

Publication types

MeSH terms

Associated data