. 2007 Nov 1;93(9):3120-31.
doi: 10.1529/biophysj.107.104737. Epub 2007 Jul 13.

Nanopipette delivery of individual molecules to cellular compartments for single-molecule fluorescence tracking

Affiliations

Nanopipette delivery of individual molecules to cellular compartments for single-molecule fluorescence tracking

Andreas Bruckbauer et al. Biophys J. .

Abstract

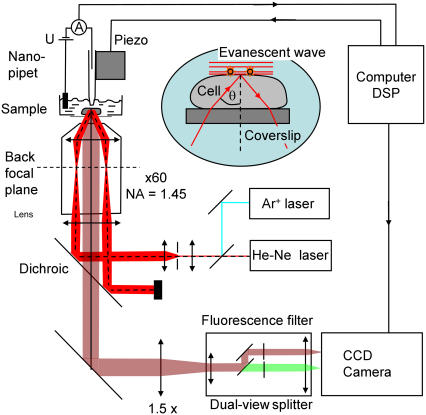
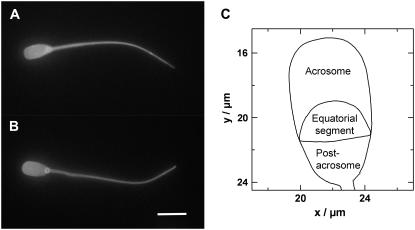
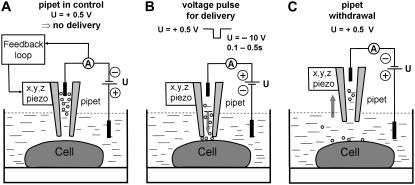
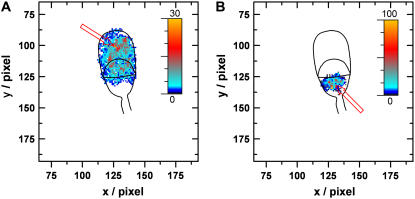
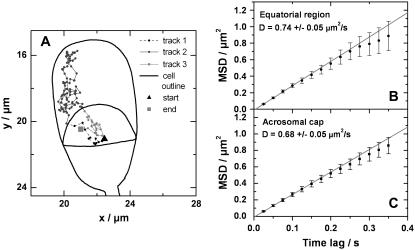
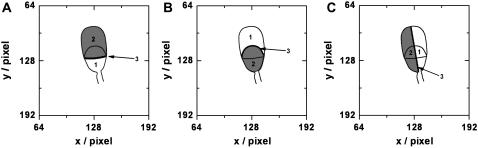
We have developed a new method, using a nanopipette, for controlled voltage-driven delivery of individual fluorescently labeled probe molecules to the plasma membrane which we used for single-molecule fluorescence tracking (SMT). The advantages of the method are 1), application of the probe to predefined regions on the membrane; 2), release of only one or a few molecules onto the cell surface; 3), when combined with total internal reflection fluorescence microscopy, very low background due to unbound molecules; and 4), the ability to first optimize the experiment and then repeat it on the same cell. We validated the method by performing an SMT study of the diffusion of individual membrane glycoproteins labeled with Atto 647-wheat germ agglutin in different surface domains of boar spermatozoa. We found little deviation from Brownian diffusion with a mean diffusion coefficient of 0.79 +/- 0.04 microm(2)/s in the acrosomal region and 0.10 +/- 0.02 microm(2)/s in the postacrosomal region; this difference probably reflects different membrane structures. We also showed that we can analyze diffusional properties of different subregions of the cell membrane and probe for the presence of diffusion barriers. It should be straightforward to extend this new method to other probes and cells, and it can be used as a new tool to investigate the cell membrane.


Figures

FIGURE 1
FIGURE 1
Schematic of single-molecule tracking experiment with nanopipette delivery. Only the HeNe laser and the red channel of the image splitter were used in these experiments.
FIGURE 2
FIGURE 2
(A and B) Two live boar spermatozoa labeled with Alexa 488-WGA from solution. Note the uniform fluorescence over the entire plasma membrane. Scale bar = 10 microns. (C) Outline of the head from a boar spermatozoa showing the different regions or macrodomains.
FIGURE 3
FIGURE 3
Deposition of Atto 647-WGA onto a coated glass slide. (A) Fluorescence image of molecules delivered by one pulse (−10 V, 300 ms) from the pipette. The scale bar is 5 μm. (B) Line scan through the fluorescent spot with Gaussian fit, showing a feature size of 0.9 μm full width at half-maximum. (C) Intensity versus time traces from the low-intensity spots surrounding the bright feature in A, showing single- and double-step photobleaching. (D) Intensity versus time trace obtained by confocal illumination and detection at the pipette tip under application of voltage pulses (−10 V, 300 ms). The beginning of the pulses are marked by arrows. The inset shows a region with high time resolution so that bursts caused by individual molecules are visible.
FIGURE 4
FIGURE 4
Schematic of the experiment showing how the probe molecules are delivered to a defined position on the sperm cell surface using the nanopipette. (A) The pipette is controlled at 100 nm distance from the cell membrane at positive potential (electrode in the bath) so that the probe molecules do not exit. (B) A negative voltage pulse is applied to deliver molecules to the cell membrane, distance control is switched off for the duration of the pulse, and fluorescence imaging starts. (C) The pipette is withdrawn rapidly at positive potential to prevent further molecules exiting the tip; fluorescence imaging continues.
FIGURE 5
FIGURE 5
(A) Image of the head of the sperm cell attached to the coverslip under white light illumination. (B) Fluorescence image showing a single Atto 647-labeled WGA molecule (arrow) on the cell membrane. Shown is one frame of a video (available as Supplementary Material). (C) Overlay of the white light and fluorescence images. Scale bars are 5 μm. (D) Typical trajectory on the anterior acrosomal region obtained by tracking a single WGA molecule, the square and triangle show the start and end of the trajectory, respectively. The idealized outline of a typical boar sperm cell is also shown. (E) Typical trajectory on the postacrosomal region.
FIGURE 6
FIGURE 6
Analysis of trajectories. (A) MSD versus time lag for the WGA molecules diffusing on the acrosome and postacrosome. For a given time lag the average of the MSD of 65 individual trajectories for the acrosome and 37 trajectories for the postacrosome region is shown. The data points and error bars give the mean ± SE. The diffusion coefficients were determined from the slope of linear fits through data points 2–10 (shown in the graph). (B and C) Histogram of diffusion coefficients of individual trajectories in the (B) acrosomal region, and (C) postacrosomal region of the sperm cell. A Gaussian fit to the histogram (continues gray curve) was added as a guide to the eye. A theoretical probability distribution (black dash dot curve) for trajectories with 84 data points is shown for comparison. This has been multiplied with the number of events and the bin width and divided by 3 for presentational purposes.
FIGURE 7
FIGURE 7
Overlay map generated by adding up all trajectories and color coding the resulting hits per pixel. Arrows show the starting position of the pipette for delivery of Atto 647-WGA to (A) acrosome and (B) postacrosome.
FIGURE 8
FIGURE 8
(A) Trajectories crossing the boundary between anterior acrosomal cap and equatorial segment were divided into different tracks. The tracks in the anterior acrosomal cap and equatorial segment were analyzed separately. (B and C) Plots of the averaged MSD curves. The diffusion coefficients were calculated from the slope of a fit to the first five data points.
FIGURE 9
FIGURE 9
Schematic showing how diffusional boundaries were probed using the measured trajectories. A six pixel wide boundary region 3 (black line) was inserted between region 1 (white) and region 2 (gray). When a molecule moves into the boundary region, this was counted as an attempted crossing event. When the molecule moves from region 1 to region 2 (or vice versa) this was counted as a successful crossing event. The crossing probability was calculated by dividing successful crossing events by attempted crossings.
FIGURE 10
FIGURE 10
Histogram of diffusion coefficients of individual trajectories on the acrosomal region of (A) testicular and (B) cauda epididymidal spermatozoa. Note the different scale for the diffusion coefficients. Gaussian fits to the data and mean values of the diffusion coefficients are shown. The insets show typical trajectories, the upper inset in A represents an almost immobile molecule, and the lower trajectory a slowly moving molecule. These measurements were done by labeling the cells from solution.

References

    1. Kusumi, A., C. Nakada, K. Ritchie, K. Murase, K. Suzuki, H. Murakoshi, R. S. Kasai, J. Kondo, and T. Fujiwara. 2005. Paradigm shift of the plasma membrane concept from the two-dimensional continuum fluid to the partitioned fluid: high-speed single-molecule tracking of membrane molecules. Annu. Rev. Biophys. Biomol. Struct. 34:351–378. - PubMed
    1. Daumas, F., N. Destainville, C. Millot, A. Lopez, D. Dean, and L. Salome. 2003. Confined diffusion without fences of a G-protein-coupled receptor as revealed by single particle tracking. Biophys. J. 84:356–366. - PMC - PubMed
    1. Schütz, G. J., G. Kada, V. P. Pastushenko, and H. Schindler. 2000. Properties of lipid microdomains in a muscle cell membrane visualized by single molecule microscopy. EMBO J. 19:892–901. - PMC - PubMed
    1. Vrljic, M., S. Y. Nishimura, S. Brasselet, W. E. Moerner, and H. M. McConnell. 2002. Translational diffusion of individual class II MHC membrane proteins in cells. Biophys. J. 83:2681–2692. - PMC - PubMed
    1. Harms, G. S., L. Cognet, P. H. M. Lommerse, G. A. Blab, H. Kahr, R. Gamsjager, H. P. Spaink, N. M. Soldatov, C. Romanin, and T. Schmidt. 2001. Single-molecule imaging of L-type Ca2+ channels in live cells. Biophys. J. 81:2639–2646. - PMC - PubMed

Publication types

LinkOut - more resources