. 2008 Jan;54(1):1-7.
doi: 10.1016/j.neuropharm.2007.05.020. Epub 2007 Jun 6.

Multiple pathways involved in the biosynthesis of anandamide

Affiliations

Multiple pathways involved in the biosynthesis of anandamide

Jie Liu et al. Neuropharmacology. 2008 Jan.

Abstract

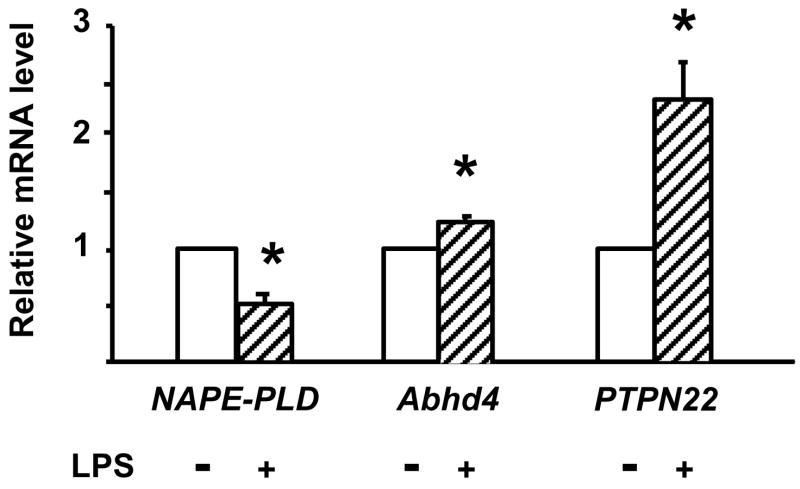
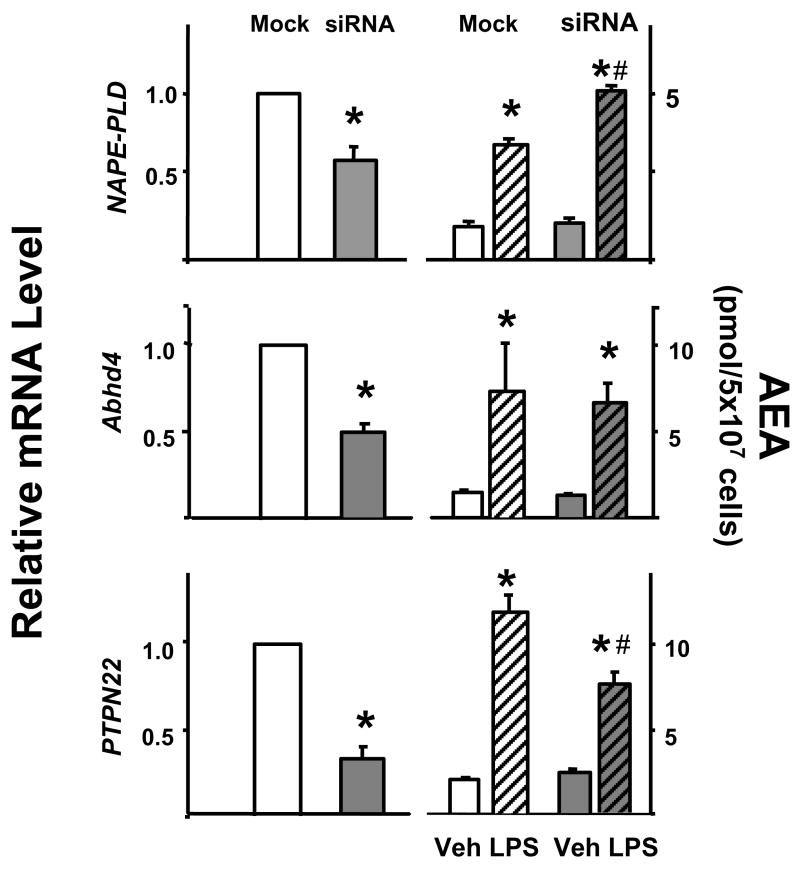
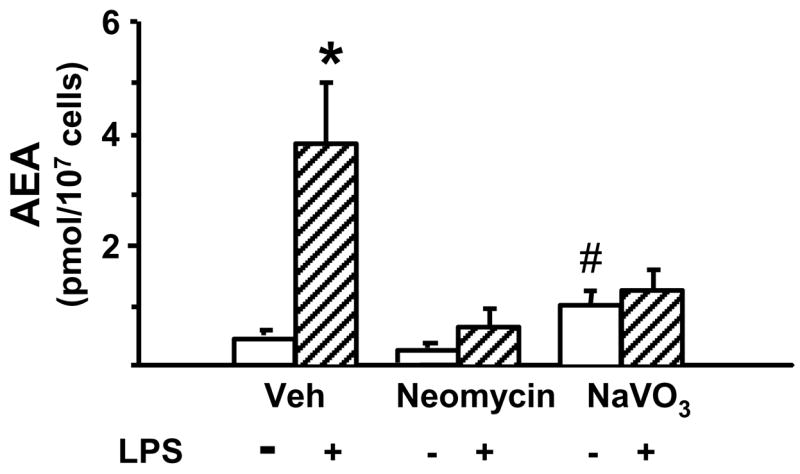
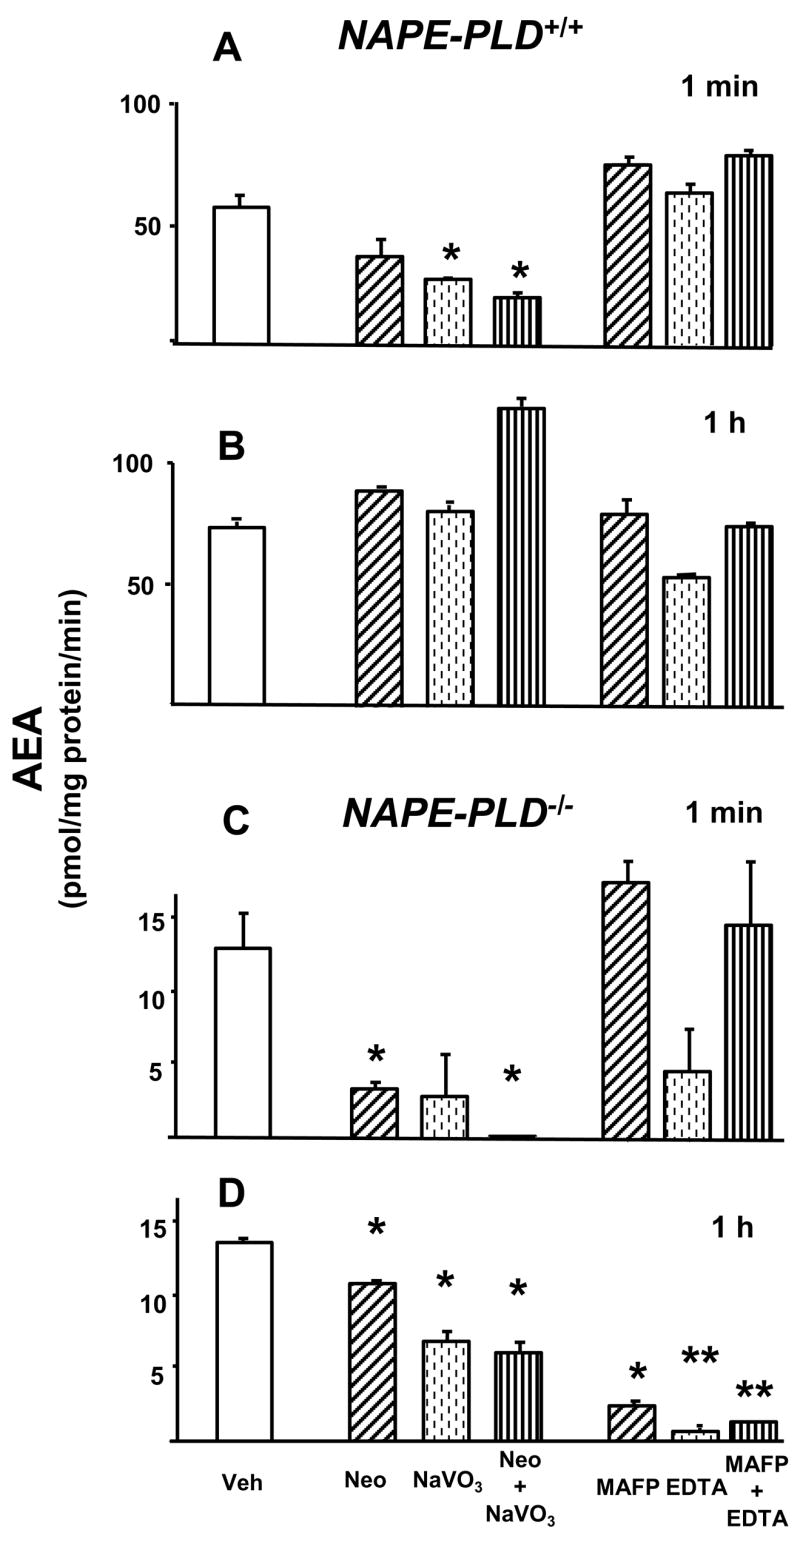
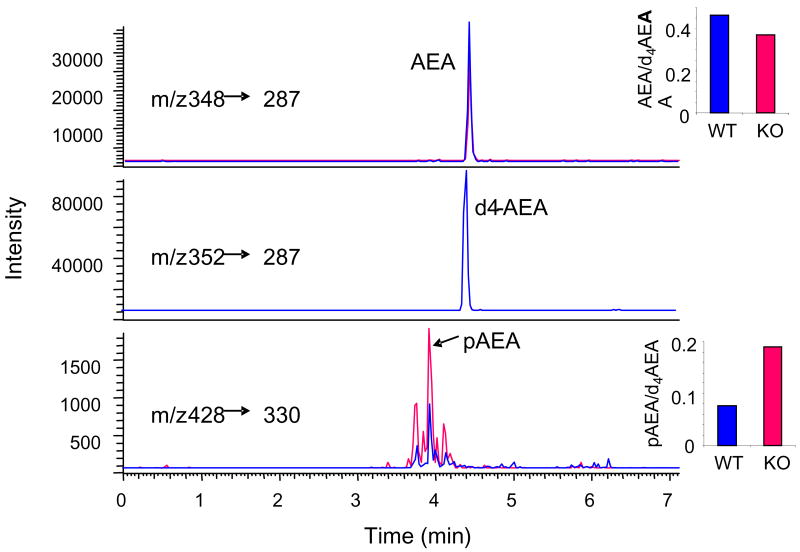
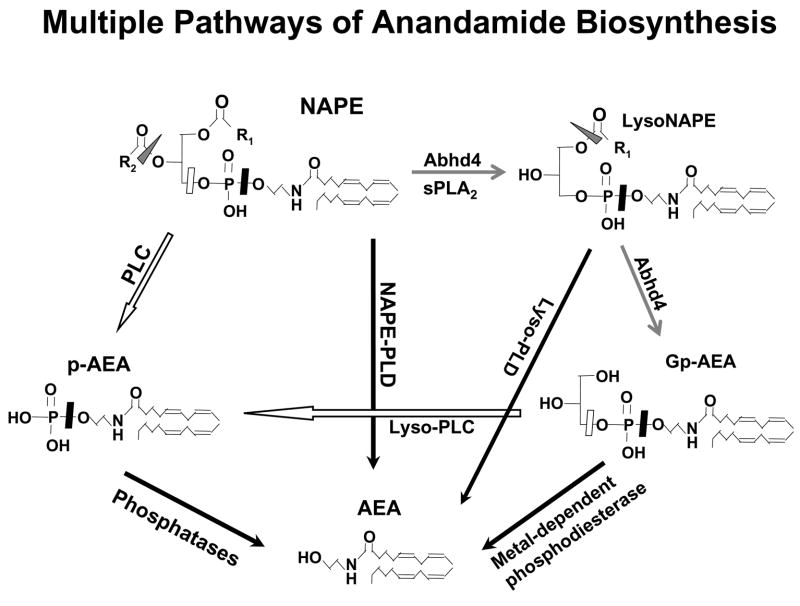
Endocannabinoids, including anandamide (arachidonoyl ethanolamide) have been implicated in the regulation of a growing number of physiological and pathological processes. Anandamide can be generated from its membrane phospholipid precursor N-arachidonoyl phosphatidylethanolamine (NAPE) through hydrolysis by a phospholipase D (NAPE-PLD). Recent evidence indicates, however, the existence of two additional, parallel pathways. One involves the sequential deacylation of NAPE by alpha,beta-hydrolase 4 (Abhd4) and the subsequent cleavage of glycerophosphate to yield anandamide, and the other one proceeds through phospholipase C-mediated hydrolysis of NAPE to yield phosphoanandamide, which is then dephosphorylated by phosphatases, including the tyrosine phosphatase PTPN22 and the inositol 5' phosphatase SHIP1. Conversion of synthetic NAPE to AEA by brain homogenates from wild-type and NAPE-PLD(-/-) mice can proceed through both the PLC/phosphatase and Abdh4 pathways, with the former being dominant at shorter (<10 min) and the latter at longer (60 min) incubations. In macrophages, the endotoxin-induced synthesis of anandamide proceeds uniquely through the phospholipase C/phosphatase pathway.


Figures

Fig. 1
Fig. 1
Effect of LPS on NAPE-PLD, PTPN22 and Abhd4 mRNA levels in RAW264.7 cells. Cells were treated with vehicle or LPS (10 ng/ml) for 90 min. mRNA was quantified by real-time PCR as described in Methods and Materials. Means ± SE from three to four experiments are shown. * indicate significant difference (P < 0.05) from values in vehicle-treated control cells, as determined by using the paired t test.
Fig. 2
Fig. 2
The effect of siRNA knockdown of NAPE-PLD, Abhd4 or PTPN22 on LPS-induced AEA synthesis in RAW264.7 cells. The degree of knockdown was verified by real-time PCR in mock-transfected (white columns) vs siRNA-transfected cells (shaded columns, left side). The right two pairs of columns indicate the cellular levels of AEA following vehicle (open columns) or LPS treatment (hatched columns) of mock- or siRNA transfected cells. Means ± SE from three experiments are shown. Significant difference from corresponding vehicle-treated group (*) or from corresponding mock-transfected group (#) is indicated, P < 0.05. Comparison of relative mRNA levels was analyzed by the paired t test, whereas the effect of LPS on cellular AEA levels was analyzed using the unpaired t test.
Fig. 3
Fig. 3
Blocking PLC or tyrosine phosphatases prevents LPS-induced AEA synthesis in RAW264.7 macrophages. The cells were preincubated for 30 min with 3 mM neomycin or with 1 mM NaVO3 before the addition of vehicle or 10 ng/ml LPS for 90 min. AEA was then quantified in lipid extracts of vehicle- (open columns) or LPS-treated (hatched columns) cells as described in Methods and Materials. Values represent means ± SE from 3–4 experiments. * indicate significant difference (P < 0.05) from values in corresponding control cells.
Fig. 4
Fig. 4
Conversion of NAPE to AEA in brain extracts from NAPE-PLD+/+ and NAPE-PLD−/− mice. Brain homogenates (10 μg protein) were pretreated with 3mM neomycin (hatched columns), 1 mM NaVO3 (dotted columns), neomycin + NaVO3 (vertical hatched columns); or 5 mM MAFP (hatched columns), 2 mM EDTA (dotted columns) or MAFP + EDTA (vertical hatched columns) for 30 min at room temperature before incubating with 10 nmol NAPE for the indicated time period at 37°C. The reaction was then terminated and AEA assayed as described in Methods and Materials. Means ± SE from three experiments are shown. Asterisks indicate significant difference (* P < 0.05; ** P < 0.005) from values in corresponding vehicle-treated controls (open columns), as analyzed by the unpaired t test.
Fig. 5
Fig. 5
Determination of pAEA and AEA by HPLC/ESI-MS/MS in brain samples. The transitions of m/z 428/330, 348/287 and 352/287 were selected for pAEA, AEA and 2H4AEA (internal standard), respectively. Note the higher pAEA and lower AEA level in the PTPN22−/− vs control brain extract.
Fig. 6
Fig. 6
Cellular pathways of anandamide biosynthesis. For explanation, see text.

References

    1. An H, Xu H, Zhang M, Zhou J, Feng T, Qian C, Qi R, Cao X. Src homology 2 domain-containing inositol-5-phosphatase 1 (SHIP1) negatively regulates TLR4-mediated LPS reponse primarily through a phosphatase activity- and PI-3K-independent mechanism. Blood. 2005;105:4685–4692. - PubMed
    1. Devane Devane WA, Hanus L, Breuer A, Pertwee RG, Stevenson LA, Griffin G, Gibson D, Mandelbaum A, Etinger A, Mechoulam R. Isolation and structure of a brain constituent that binds to the cannabinoid receptor. Science. 1992;258:1946–1949. - PubMed
    1. Di Marzo V, Fontana A, Cadas H, Schinelli S, Cimino G, Schwartz JC, Piomelli D. Formation and inactivation of endogenous cannabinoid anandamide in central neurons. Nature. 1994;372:686–691. - PubMed
    1. Eibl H. Phospholipid synthesis: oxazaphospholanes and dioxaphospholanes as intermediates. Proc Natl Acad Sci USA. 1978;75:4074–4077. - PMC - PubMed
    1. Engeli S, Bohnke J, Feldpausch M, Gorzelniak K, Janke J, Batkai S, Pacher P, Harvey-White J, Luft FC, Sharma AM, Jordan J. Activation of the peripheral endocannabinoid system in human obesity. Diabetes. 2005;54:2838–2843. - PMC - PubMed

Publication types

MeSH terms

Substances

LinkOut - more resources