. 2007 Nov 10;368(1):60-72.
doi: 10.1016/j.virol.2007.06.001. Epub 2007 Jul 13.

HIV-1 integrates into resting CD4+ T cells even at low inoculums as demonstrated with an improved assay for HIV-1 integration

Affiliations

HIV-1 integrates into resting CD4+ T cells even at low inoculums as demonstrated with an improved assay for HIV-1 integration

Luis M Agosto et al. Virology. .

Abstract

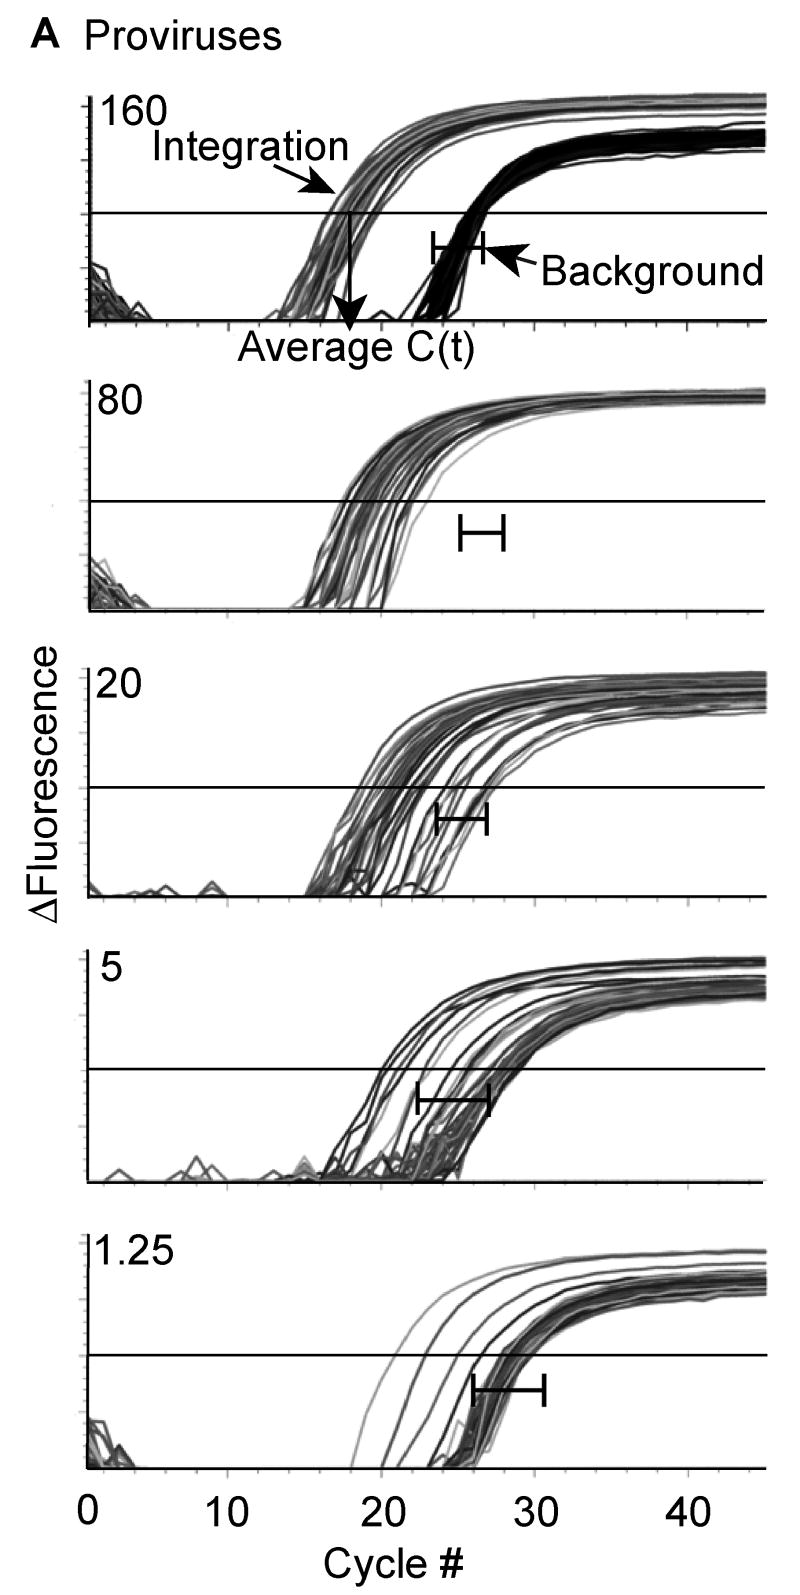
Human Immunodeficiency Virus Type 1 (HIV-1) establishes a latent reservoir early in infection that is resistant to the host immune response and treatment with highly active antiretroviral therapy (HAART). The best understood of these reservoirs forms in resting CD4(+) T cells. While it remains unclear how reservoirs form, a popular model holds that the virus can only integrate in activated CD4(+) T cells. Contrary to this model, our previous results suggest that HIV-1 can integrate directly into the genomes of resting CD4(+) T cells. However, a limitation of our previous studies was that they were conducted at high viral inoculum and these conditions may lead to cellular activation or saturation of restriction factors. In the present study, we tested if our previous findings were an artifact of high inoculum. To do this, we enhanced the sensitivity of our integration assay by incorporating a repetitive sampling technique that allowed us to capture rare integration events that occur near an Alu repeat. The new technique represents a significant advance as it enabled us to measure integration accurately down to 1 provirus/well in 15,000 genomes--a 40-fold enhancement over our prior assay. Using this assay, we demonstrate that HIV can integrate into resting CD4(+) T cells in vitro even at low viral inoculum. These findings suggest there is no threshold number of virions required for HIV to integrate into resting CD4(+) T cells.


Figures

Figure 1
Figure 1. Repetitive sampling increases the sensitivity of the integration assay
1A. DNA from the polyclonal IS was diluted into a constant amount of uninfected human genomic DNA and subjected to our 2-step Alu-PCR. The first PCR reaction used primers to Alu and gag or only primers to gag. The second PCR reaction used HIV-1 specific primers to the LTR elements, R and U5. For each dilution sample, Alu-gag and gag-only (background) amplification was measured 40 times and the provirus number was determined. At low proviral copy number, integration is detected at a low frequency as demonstrated by the Alu-gag amplification. For clarity, we did not show the gag-only signals at the lower dilutions, but instead show the bracketed black lines ( |―| ) which represent where the gag-only signal (background) was detected at each proviral number. 1B. A log-log relationship exists between the average cycle threshold value and the provirus number. Given the provirus number in our integration standard, we were able to determine the relationship between the average cycle threshold (CT) value and the provirus number. The average cycle threshold is obtained by averaging the cycle numbers where each PCR amplification curve crosses the y = -2.5. After calculating the average CT for IS at several provirus counts, a linear regression was performed on the natural logarithm of the average CT and the natural logarithm of the average provirus count to obtain the following formula: ln(n)≅ −9.6999 × ln(Ct) + 33.079. Each point represents 40 measurements performed at each IS concentration and the error bars represent the standard deviation.
Figure 2
Figure 2. Alu-gag amplification depends on the distance between Alu and integrated virus
Alu-gag amplification efficiency was related to the distance between the HIV-1 integration site and the nearest Alu sequence. Alu-gag amplification, and hence integration, was undetectable when HIV-1 integrated >5000 bp from the nearest Alu site. 2A. Four clones (A, B, C, and D) were derived from polyclonal IS-293. The clones were generated by culturing IS-293 at ∼1 cell/well. For each clone, the distance from the nearest Alu to gag was determined as described in Materials and methods. 2B. Alu-gag amplification was more efficient when the nearest Alu was close to the integration site and undetectable when Alu was far from the integration site. DNA from each clone was subjected to 2-step PCR. Alu-gag and gag-only were measured three times and the response curves for each clone are shown. In every experiment, a horizontal threshold line was drawn at y = -2.5. The smaller the distance between HIV-1 gag and Alu, the more efficient the amplification and the lower the CT (compare A and D). For each clone, the Alu-gag response curves were compared to the gag-only response curves. When the distance between HIV-1 gag and Alu was >5000 bp, as in clone D, there was no difference between the Alu-gag signal (integration) and the gag-only signal (background).
Figure 3
Figure 3. Purification of resting CD4+ T cells
PBMC (enriched by leukapheresis) were negatively depleted by RBC rosette using antibodies against: Glycophorin A, CD8, 16, 19, 36, 56, 66b and TCRγδ to yield >96% partially purified CD4+ T cells (ppCD4). ppCD4 were then stained with PE-labeled antibodies with specificities for HLA-DR, CD25 and CD69 in order to deplete activated cells with anti-PE magnetic beads. Purified resting CD4+ T cells (rCD4) contain less than 1% activated T cells. The gates were placed based on fluorescence minus one (FMO) controls, which were only labeled with anti-CD4. The gates were set conservatively such that 1% of unstained cells were in the upper quadrants. The above figure represents a typical purification of resting CD4+ T cells.
Figure 4
Figure 4. Integration of HIV-1 in CD4+ T cells is detected at low viral inoculum
A dose-dependent decrease in viral integration was observed with serial dilution of the viral inoculum (A, B). ppCD4 cells were inoculated with three-fold dilutions of supernatant containing VSV-G pseudotyped pNL4-3. The dark bars indicated by an asterisk represent the number of virions bound per cell. The top and bottom viral dilutions correspond to 16 and 0.36 virions/cell respectively based on p24 ELISA (O'Doherty, Swiggard, and Malim, 2000). Cells were inoculated by routine inoculation for 2hr at 25°C. A dose-dependent decrease in RU5 reverse transcripts was also observed with serial dilution of the viral inoculum. The results are presented in provirus per cell (A), log(3) of provirus per cell (B), RU5 per cell (C, D) and log(3) RU5 per cell (D). The level of viral integration and reverse transcripts are shown as log(3) to convert the exponential relationship (A,C) to a linear relationship (B,D). Error bars represent the standard deviation of 5-51 measurements of integration and 4-8 measurements of reverse transcripts, respectively, for each virus dilution depending on proviral number (and sample availability). More repeats were required to capture integration events at low proviral numbers. The number of proviruses/cell and RU5/cell are written above each point (B, D).
Figure 5
Figure 5. Integration of wild type HIV-1 in pure resting CD4+ T cells exhibits a dose-dependent decrease in integration and reverse transcription with each dilution
A dose-dependent decrease in viral integration (A) and reverse transcription (B) was observed with serial dilution of the viral inoculum. Resting CD4+ T cells were inoculated with two-fold dilutions of supernatant containing pNL4-3. Cells were inoculated by routine inoculation for 2hr at 25°C. After infection, the cells were cultured for 72hr before measuring integration. The results are presented in log(2) of provirus per cell (A) and log(2) of RU5 per cell (B). For integration, the error bar at the top dilution represents the standard error of 5 independent inoculations. Each inoculation at the top dilution was measured for viral integration 10-12 times depending on sample availability. The error bars of the lower dilutions represent the standard deviation of 12-42 measurements of integration for each virus dilution depending on sample availability. In general more replicates were performed at the lower dilutions. For reverse transcription, the error bar at the top dilution represents the standard error of 5 independent inoculations. Each inoculation at the top dilution was measured for reverse transcription 2-6 times depending on sample availability. The error bars of the lower dilutions represent the standard deviation of 4-6 measurements of reverse transcription for each virus dilution depending on sample availability. The number of proviruses/cell and RU5/cell are written above each point.
Figure 6
Figure 6. Sorting strategy to obtain highly pure resting and intermediately activated CD4+ T cells
Resting and intermediately activated CD4+ T cells were sort-purified from PBMC by FACS Aria. PBMC were stained with FITC-labeled antibodies against lineage markers (CD8, CD14, CD16, CD20, CD56) and PE-labeled antibodies against activation markers (CD25, CD69, HLA-DR)(pre-sort). Gates were set around the double negative and activation intermediate populations to obtain 98% and 94% pure resting and intermediately activated CD4+ T cells respectively (post-sort).
Figure 7
Figure 7. Both resting and intermediately activated CD4+ T cells have similar susceptibility to HIV-1 integration
Resting, intermediately activated and stimulated CD4+ T cells were infected with 3-fold dilutions of the same pNL4-3 stock, but a different stock of virus than in Figure 5. After infection, the cells were cultured for 48 (resting and intermediately activated) or 24hr (stimulated) before measuring integration (A) and reverse transcription (B). The level of reverse transcription was determined using primers that detect the second strand transfer step (SST/cell). Both resting and intermediately activated cells had similar susceptibility to HIV-1 integration and reverse transcription while stimulated cells were more susceptible. Error bars represent the standard deviation of 8-15 measurements of integration and duplicate measurements of reverse transcription depending on sample availability. The number of proviruses/cell and SST/cell are written above each point.

References

    1. Adachi A, Gendelman HE, Koenig S, Folks T, Willey R, Rabson A, Martin MA. Production of acquired immunodeficiency syndrome-associated retrovirus in human and nonhuman cells transfected with an infectious molecular clone. J Virol. 1986;59(2):284–91. - PMC - PubMed
    1. Besnier C, Takeuchi Y, Towers G. Restriction of lentivirus in monkeys. Proc Natl Acad Sci U S A. 2002;99(18):11920–5. - PMC - PubMed
    1. Best S, Le Tissier P, Towers G, Stoye JP. Positional cloning of the mouse retrovirus restriction gene Fv1. Nature. 1996;382:826–829. - PubMed
    1. Blankson JN, Persaud D, Siliciano RF. The challenge of viral reservoirs in HIV-1 infection. Annual Review of Medicine. 2002;53:557–593. - PubMed
    1. Blumenthal R, Bali-Puri A, Walter A, Covell D, Eidelman O. pH-dependent fusion of vesicular stomatitis virus with Vero cells. Measurement by dequenching of octadecyl rhodamine fluorescence. J Biol Chem. 1987;262(28):13614–9. - PubMed

Publication types