

A neural mass model of spectral responses in electrophysiology
- PMID: 17632015
- PMCID: PMC2644418
- DOI: 10.1016/j.neuroimage.2007.05.032
A neural mass model of spectral responses in electrophysiology
Abstract
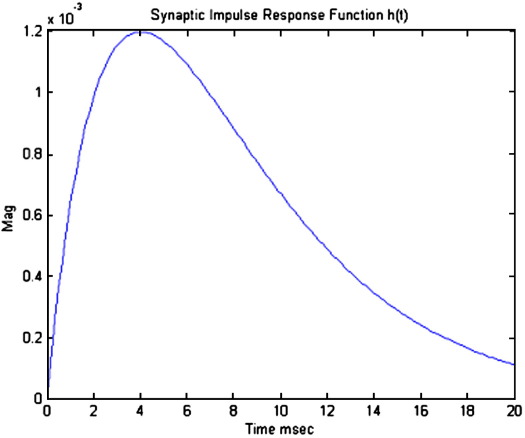
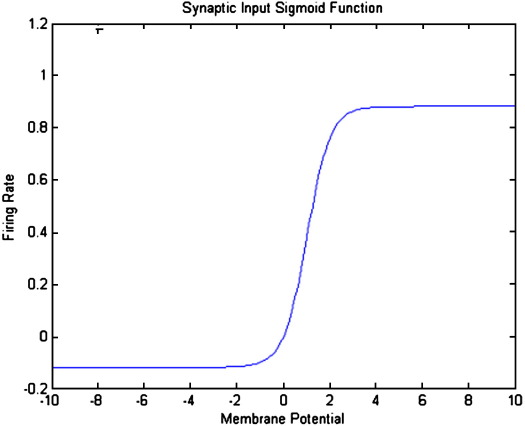
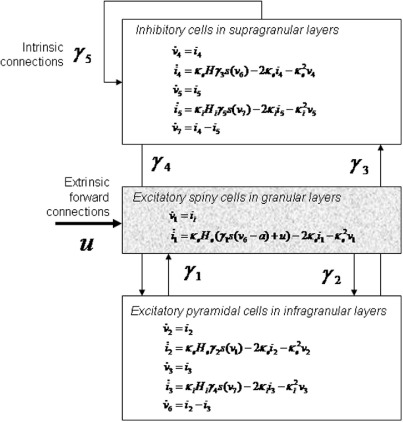
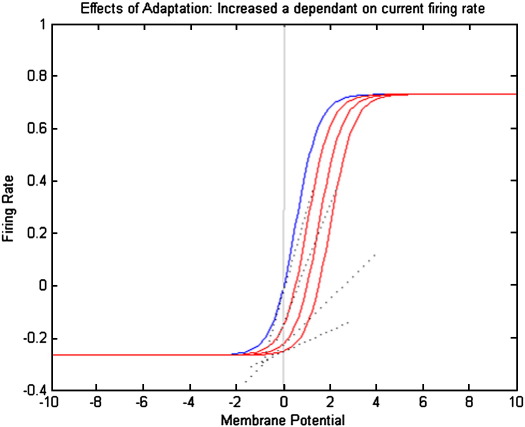
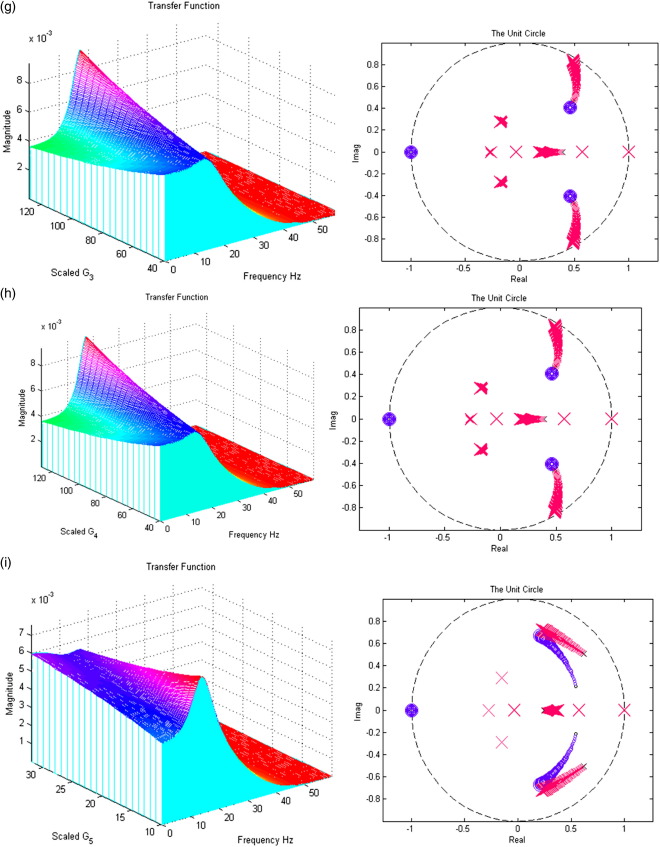
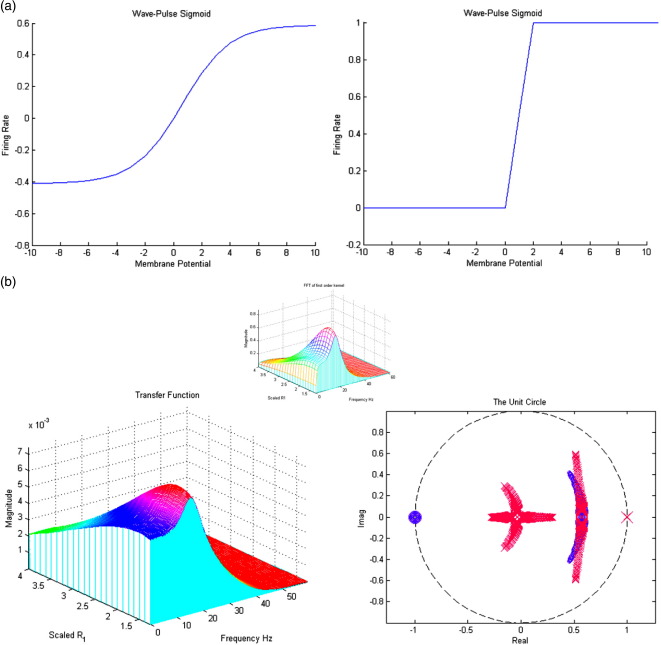
We present a neural mass model of steady-state membrane potentials measured with local field potentials or electroencephalography in the frequency domain. This model is an extended version of previous dynamic causal models for investigating event-related potentials in the time-domain. In this paper, we augment the previous formulation with parameters that mediate spike-rate adaptation and recurrent intrinsic inhibitory connections. We then use linear systems analysis to show how the model's spectral response changes with its neurophysiological parameters. We demonstrate that much of the interesting behaviour depends on the non-linearity which couples mean membrane potential to mean spiking rate. This non-linearity is analogous, at the population level, to the firing rate-input curves often used to characterize single-cell responses. This function depends on the model's gain and adaptation currents which, neurobiologically, are influenced by the activity of modulatory neurotransmitters. The key contribution of this paper is to show how neuromodulatory effects can be modelled by adding adaptation currents to a simple phenomenological model of EEG. Critically, we show that these effects are expressed in a systematic way in the spectral density of EEG recordings. Inversion of the model, given such non-invasive recordings, should allow one to quantify pharmacologically induced changes in adaptation currents. In short, this work establishes a forward or generative model of electrophysiological recordings for psychopharmacological studies.
Figures
Similar articles
-
Identifying interactions in mixed and noisy complex systems.Phys Rev E Stat Nonlin Soft Matter Phys. 2006 May;73(5 Pt 1):051913. doi: 10.1103/PhysRevE.73.051913. Epub 2006 May 23. Phys Rev E Stat Nonlin Soft Matter Phys. 2006. PMID: 16802973
-
Bayesian estimation of synaptic physiology from the spectral responses of neural masses.Neuroimage. 2008 Aug 1;42(1):272-84. doi: 10.1016/j.neuroimage.2008.01.025. Epub 2008 Feb 1. Neuroimage. 2008. PMID: 18515149 Free PMC article.
-
Neural fields, spectral responses and lateral connections.Neuroimage. 2011 Mar 1;55(1):39-48. doi: 10.1016/j.neuroimage.2010.11.081. Epub 2010 Dec 4. Neuroimage. 2011. PMID: 21138771 Free PMC article.
-
What is the source of the EEG?Clin EEG Neurosci. 2009 Jul;40(3):146-9. doi: 10.1177/155005940904000305. Clin EEG Neurosci. 2009. PMID: 19715175 Review.
-
Plasticity, learning, and complexity in spiking networks.Crit Rev Biomed Eng. 2012;40(6):501-18. doi: 10.1615/critrevbiomedeng.2013006724. Crit Rev Biomed Eng. 2012. PMID: 23356694 Review.
Cited by
-
Systems approaches to optimizing deep brain stimulation therapies in Parkinson's disease.Wiley Interdiscip Rev Syst Biol Med. 2018 Sep;10(5):e1421. doi: 10.1002/wsbm.1421. Epub 2018 Mar 20. Wiley Interdiscip Rev Syst Biol Med. 2018. PMID: 29558564 Free PMC article. Review.
-
Dynamic causal models of steady-state responses.Neuroimage. 2009 Feb 1;44(3):796-811. doi: 10.1016/j.neuroimage.2008.09.048. Epub 2008 Oct 17. Neuroimage. 2009. PMID: 19000769 Free PMC article.
-
Dynamic causal modelling for EEG and MEG.Cogn Neurodyn. 2008 Jun;2(2):121-36. doi: 10.1007/s11571-008-9038-0. Epub 2008 Apr 23. Cogn Neurodyn. 2008. PMID: 19003479 Free PMC article.
-
DCM for complex-valued data: cross-spectra, coherence and phase-delays.Neuroimage. 2012 Jan 2;59(1):439-55. doi: 10.1016/j.neuroimage.2011.07.048. Epub 2011 Jul 28. Neuroimage. 2012. PMID: 21820062 Free PMC article.
-
Thalamocortical dynamics underlying spontaneous transitions in beta power in Parkinsonism.Neuroimage. 2019 Jun;193:103-114. doi: 10.1016/j.neuroimage.2019.03.009. Epub 2019 Mar 9. Neuroimage. 2019. PMID: 30862535 Free PMC article.
References
-
- Accardo A., Affinito M., Carrozzi M., Bouqet F. Use of fractal dimension for the analysis of electroencephalographic time series. Biol. Cybern. 1997;77:339–350. - PubMed
-
- Barlow J.S. MIT Press; 1993. The Electroencephalogram, Its Patterns and Origins.
-
- Barrie J.M., Freeman W.J., Lenhart M.D. Spatiotemporal analysis of prepyriform, visual, auditory and somethetic surface EEGs in trained rabbits. J. Neurophysiol. 1996;76(1):520–539. - PubMed
-
- Benda J., Herz A.V. A universal model for spike-frequency adaptation. Neural. Comput. 2003;15(11):2523–2564. (Nov) - PubMed
-
- Breakspear M., Roberts J.A., Terry J.R., Rodrigues S., Mahant N., Robinson P.A. A unifying explanation of primary generalized seizures through nonlinear brain modeling and bifurcation analysis. Cereb. Cortex. 2006;16(9):1296–1313. (Sep.) - PubMed
Publication types
MeSH terms
Grants and funding
LinkOut - more resources
Full Text Sources
Other Literature Sources
