. 2007 Jul 13;130(1):77-88.
doi: 10.1016/j.cell.2007.05.042.

A chromatin landmark and transcription initiation at most promoters in human cells

Affiliations

A chromatin landmark and transcription initiation at most promoters in human cells

Matthew G Guenther et al. Cell. .

Abstract

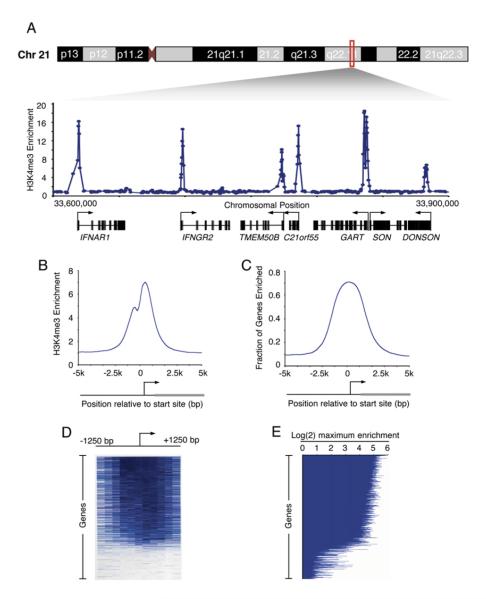
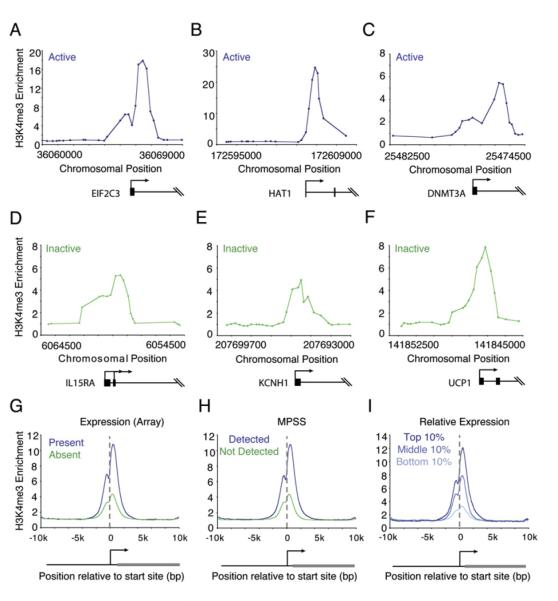
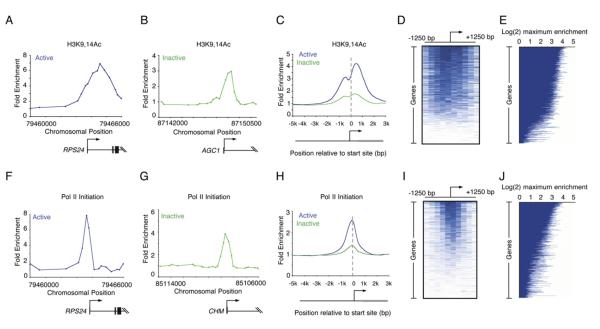
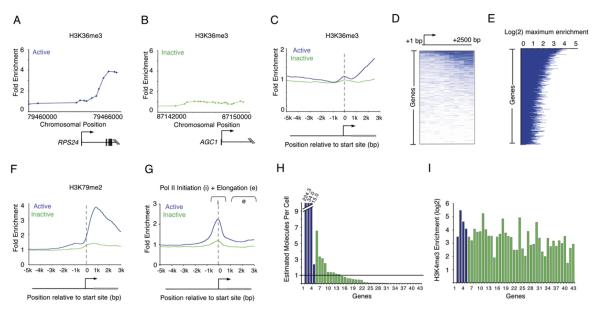
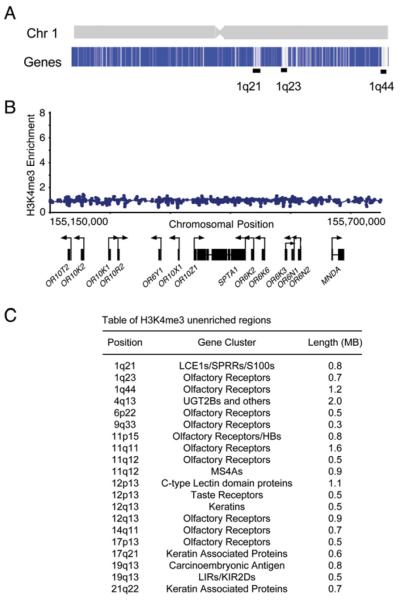
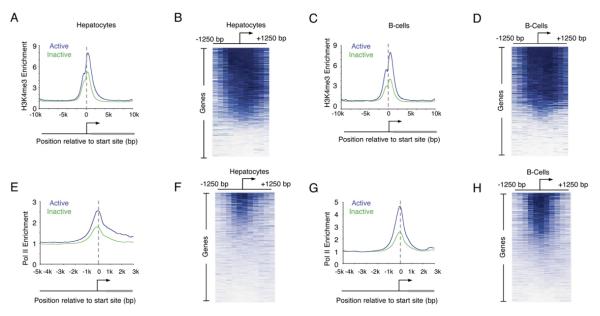
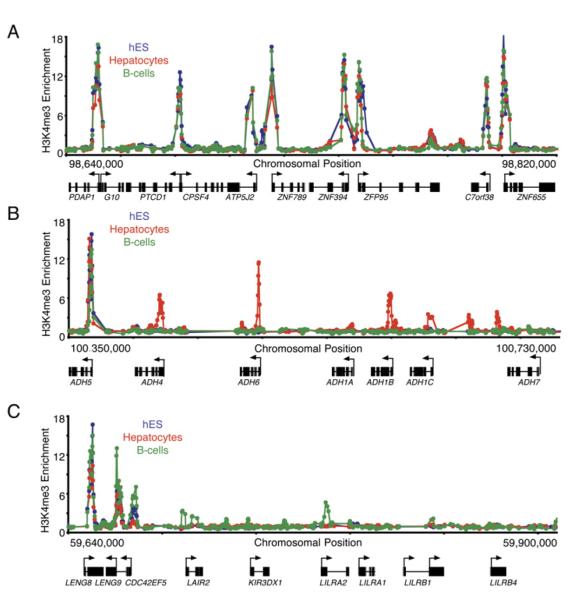
We describe the results of a genome-wide analysis of human cells that suggests that most protein-coding genes, including most genes thought to be transcriptionally inactive, experience transcription initiation. We found that nucleosomes with H3K4me3 and H3K9,14Ac modifications, together with RNA polymerase II, occupy the promoters of most protein-coding genes in human embryonic stem cells. Only a subset of these genes produce detectable full-length transcripts and are occupied by nucleosomes with H3K36me3 modifications, a hallmark of elongation. The other genes experience transcription initiation but show no evidence of elongation, suggesting that they are predominantly regulated at postinitiation steps. Genes encoding most developmental regulators fall into this group. Our results also identify a class of genes that are excluded from experiencing transcription initiation, at which mechanisms that prevent initiation must predominate. These observations extend to differentiated cells, suggesting that transcription initiation at most genes is a general phenomenon in human cells.


Figures

Figure 1
Figure 1. H3K4me3-Modified Nucleosomes Are Found at Sites of Transcription Initiation
(A) Genomic DNA segments enriched for H3K4me3-modified histones in hES cells were identified with ChIP-chip using DNA microarrays tiling the nonrepeat human genome. Enrichment ratios for H3K4me3 across 300 kb of chromosome 21 are shown. Start sites and direction of transcription are indicated by arrows. (B) Composite H3K4me3 enrichment profile for all known genes. The start site and direction of transcription of the average gene are indicated by an arrow. Details of composite profile generation are described in Supplemental Experimental Procedures. (C) Fraction of genes enriched for H3K4me3 (enrichment ratio > 2) was calculated for all known promoters. All genes were aligned according to the position of their transcription start sites, and the fraction of genes with enriched H3K4me3 binding was then calculated in a sliding 200 bp window. (D) Single-probe enrichment ratios of H3K4me3 across the 2.5 kb region surrounding the transcription start site (~10 probes per promoter). Enriched probes (blue) and unenriched probes (white) are shown for each gene. Individual promoters are represented top to bottom and are ordered by average binding ratio within a 1 kb window surrounding the transcription start site. (E) H3K4me3 maximum enrichment (blue horizontal line) within 1 kb of the transcription start site for each gene represented on the whole-genome array. Genes are ordered as in (D).
Figure 2
Figure 2. H3K4me3-Modified Nucleosomes Are Enriched at Both Active and Inactive Promoters
(A–F) Genomic DNA segments enriched for H3K4me3-modified histones were identified with ChIP-chip using DNA microarrays spanning the entire nonrepeat portion of the human genome. Enrichment ratios are shown for H3K4me3 at active genes (mRNA transcript called “present” in Affymetrix expression data and detected by massively parallel signature sequencing [MPSS] data) and inactive genes (mRNA transcript called “absent” in Affymetrix expression data and not detected by MPSS data). Gene start and direction of transcription are indicated by arrows. (G–I) Composite H3K4me3 enrichment profiles for genes called present or absent for mRNA transcript using Affymetrix data (G) (Sato et al., 2003; Abeyta et al., 2004); genes detected or not detected by MPSS (H) (Brandenberger et al., 2004a; Wei et al., 2005); and genes in the top 10%, middle 10%, or bottom 10% by relative expression (I) (Su et al., 2004).
Figure 3
Figure 3. Enrichment of H3K9,14Ac and Pol II at Inactive Genes
(A and B) Enrichment ratios are shown for H3K9,14Ac, which is associated with initiation. The start site and direction of transcription are indicated by an arrow. (C) Composite enrichment profiles for H3K9,14Ac at genes called present or absent for mRNA transcripts using microarray data (as in Figure 2G). (D) Single-probe enrichment ratios of H3K9,14Ac across the average 2.5 kb region surrounding the transcription start site (~10 probes per promoter). Enriched probes (blue) and unenriched probes (white) are shown for each gene. Individual promoters are represented top to bottom and are ordered by average binding ratio within 1 kb surrounding the transcription start site (as in Figure 1D). (E) H3K9,14Ac maximum enrichment (blue horizontal line) within 1 kb of the transcription start site for each gene represented on the human promoter array. Genes are ordered as in (D). (F and G) Enrichment ratios are shown for initiating Pol II (antibody 8WG16). (H) Composite enrichment profiles for initiating Pol II at genes called present or absent for mRNA transcripts using microarray data (as in Figure 2G). (I) Single-probe enrichment ratios of initiating Pol II across the average 2.5 kb region surrounding the transcription start site (~10 probes per promoter). Enriched probes (blue) and unenriched probes (white) are shown for each gene. Individual promoters are represented top to bottom and are ordered by average binding ratio within 1 kb surrounding the transcription start site (as in Figure 1D). (J) Initiating Pol II maximum enrichment (blue horizontal line) within 1 kb of the transcription start site for each gene represented on the human promoter array. Genes are ordered as in (I).
Figure 4
Figure 4. Events Associated with Transcriptional Elongation Occur at a Minority of Genes
(A and B) Enrichment ratios are shown for H3K36me3, which is associated with elongation. The start site and direction of transcription are indicated by an arrow. (C) Composite enrichment profiles for H3K36me3 at genes called present or absent for mRNA transcripts using microarray data (as in Figure 2G). The start site and direction of transcription of the average gene are indicated by an arrow. (D) Single-probe enrichment ratios of H3K36me3 across the average 2.5 kb region downstream of the transcription start site (~10 probes per promoter). Enriched probes (blue) and unenriched probes (white) are shown for each gene. Individual genes are represented top to bottom and are ordered by average binding ratio across the entire region. (E) H3K36me3 maximum enrichment (blue horizontal line) between 1 kb and 3 kb of the transcription start site for each gene represented on the human promoter array. Genes are ordered as in (D). (F) Composite enrichment profiles for H3K79me2 at genes called present or absent for mRNA transcripts using microarray data (as in Figure 2G). (G) Composite enrichment profiles for Pol II (4H8) at genes called present or absent for mRNA transcripts using microarray data (as in Figure 2G). Both the initiating and elongating forms of Pol II are recognized by this antibody. The area from 1 kb to 3 kb downstream of the promoter (designated e) was used to determine genes enriched. The start site and direction of transcription of the average gene are indicated by an arrow. (H) Quantitative RT-PCR analysis of total RNA extracted from hES cells. Estimated transcripts per cell were obtained by dividing the number of molecules of cDNA, as determined by relative quantitation using the standard curve in Figure S5, by the number of cells used for the amplification. Positive control probes (active genes, blue bars) and test sample probes (Inactive genes, green bars) are as follows: (1) No probe, (2) RPLPO, (3) HMGB2, (4) CCNB1, (5) EIF2C3, (6) HOP, (7) GUCY1A3,(8) KITLG, (9) SOX9, (10) PLD1, (11) INCENP, (12) ERCC4, (13) CSF1, (14) HOXB1, (15) GPR143, (16) DSC3, (17) NFKBIL2, (18) ANG, (19) LEFTY1, (20) LNPEP, (21) TCF21, (22) RAP1GA1,(23) KLF2, (24) KCNJ3, (25) TNFSF7, (26) PRRG2, (27) FOXG1B, (28) DLX5, (29) KCNH1, (30) ACADL, (31) CXCL2, (32) HOXD12, (33) ONECUT1, (34) LYST, (35) PCSK2, (36) AVPR1B, (37) SMP3, (38) EPHX2, (39) UCP1, (40) AGC1, (41) ERAF, (42) HBA1, (43) MLNR. Measured values for the genes can be found in Table S6. Broken axis is indicated by white line. (I) H3K4me3 maximum enrichment (within 1 kb of the transcription start site) for each gene represented in (H).
Figure 5
Figure 5. Genes Not Enriched for H3K4me3 Are Found in Clusters along the Genome
(A) Top shows schematic representation of chromosome 1; bottom shows maximum enrichment ratios of H3K4me3 within 1 kb of the transcription start site for each gene of chromosome 1. Genes are shaded blue (H3K4me3 positive) to white (H3K4me3 unenriched). Large clusters of genes not enriched for H3K4me3 are indicated by black bars. (B) Enlarged view of a portion of the 1q23 band of chromosome 1 containing a cluster of olfactory genes devoid of H3K4me3 enrichment. Ratios for H3K4me3 are shown across 550 kb spanning 11 olfactory receptors. (C) Table of H3K4me3 unenriched regions containing at least ten consecutive genes.
Figure 6
Figure 6. Enrichment of H3K4me3 at Inactive Genes Occurs in Differentiated Cells
(A, C, E, and G) Composite enrichment profiles for H3K4me3 (A and C) and Pol II (E and G) in primary human hepatocytes (A and E) and the REH line of pro-B cells (C and G) at genes called present or absent for mRNA transcript using microarray data as in Figure 2G. (B, D, F, and H) Enriched probe (blue) and unenriched probe (white) profiles for H3K4me3 (B and D) and Pol II (F and H) are shown for each gene in hepatocytes (B and F) and B cells (D and H). Individual genes are represented top to bottom and are ordered by average binding ratio within 1 kb surrounding the transcription start site as in Figure 1D.
Figure 7
Figure 7. Tissue-Specific Methylation of H3K4 at Gene Clusters
(A) Enrichment ratios for H3K4me3 from hES cells (blue), primary human hepatocytes (red), and the REH line of pro-B cells (green) across 180 kb of chromosome 7 are shown. Start sites and direction of transcription are indicated by arrows. (B) Enrichment ratios for H3K4me3 from hES cells (blue), primary human hepatocytes (red), and the REH line of pro-B cells (green) across 380 kb of chromosome 4 spanning the alcohol dehydrogenase cluster are shown. ADH1A is specifically expressed in fetal liver, and ADH7 is expressed in gastric tissue. Constitutively H3K4me3-modified ADH5 is expressed in all samples tested. (C) Enrichment ratios for H3K4me3 from hES cells (blue), primary human hepatocytes (red), and the REH line of pro-B cells (green) across 260 kb of chromosome 19 spanning the leukocyte receptor cluster are shown.

Comment in

References

    1. Abeyta MJ, Clark AT, Rodriguez RT, Bodnar MS, Pera RA, Firpo MT. Unique gene expression signatures of independently-derived human embryonic stem cell lines. Hum. Mol. Genet. 2004;13:601–608. - PubMed
    1. Agalioti T, Chen G, Thanos D. Deciphering the transcriptional histone acetylation code for a human gene. Cell. 2002;111:381–392. - PubMed
    1. Azuara V, Perry P, Sauer S, Spivakov M, Jorgensen HF, John RM, Gouti M, Casanova M, Warnes G, Merkenschlager M, Fisher AG. Chromatin signatures of pluripotent cell lines. Nat. Cell Biol. 2006;8:532–538. - PubMed
    1. Bannister AJ, Schneider R, Myers FA, Thorne AW, Crane-Robinson C, Kouzarides T. Spatial distribution of di- and trimethyl lysine 36 of histone H3 at active genes. J. Biol. Chem. 2005;280:17732–17736. - PubMed
    1. Bernstein BE, Humphrey EL, Erlich RL, Schneider R, Bouman P, Liu JS, Kouzarides T, Schreiber SL. Methylation of histone H3 Lys 4 in coding regions of active genes. Proc. Natl. Acad. Sci. USA. 2002;99:8695–8700. - PMC - PubMed

Publication types

MeSH terms