. 2007 Jul 13;130(1):141-52.
doi: 10.1016/j.cell.2007.05.026.

Stability and nuclear dynamics of the bicoid morphogen gradient

Affiliations

Stability and nuclear dynamics of the bicoid morphogen gradient

Thomas Gregor et al. Cell. .

Abstract

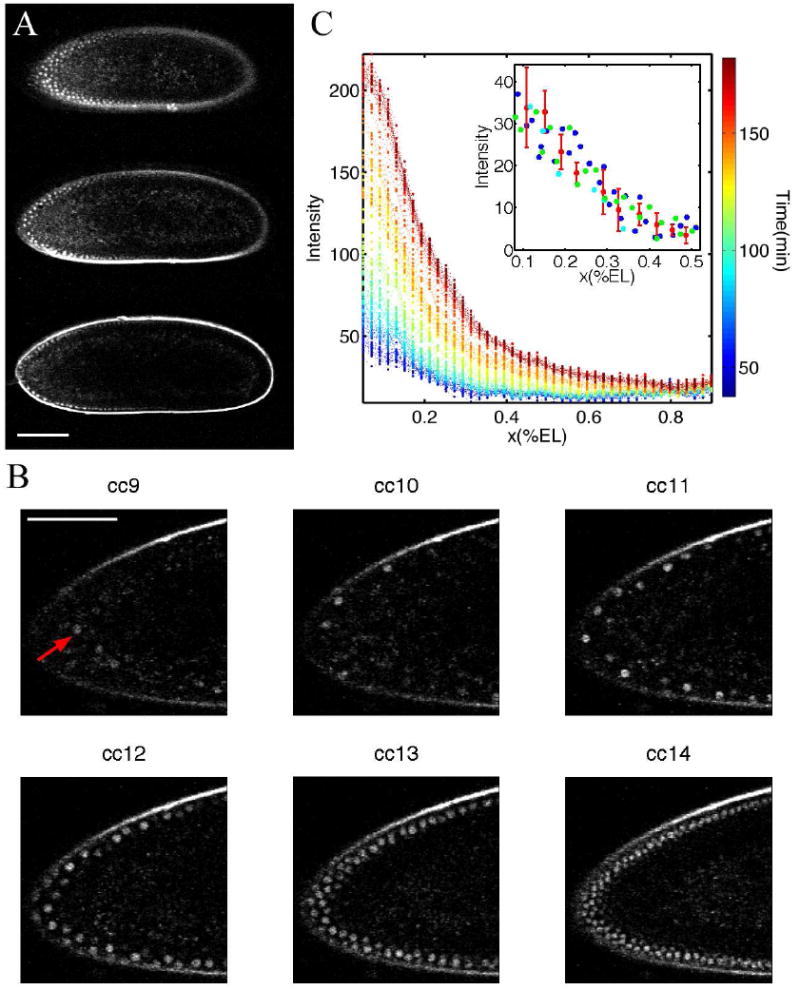
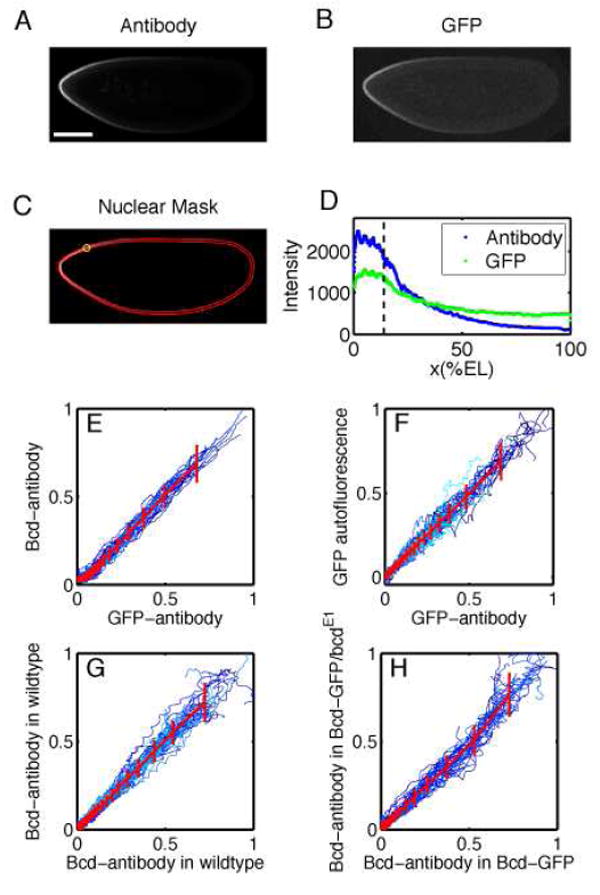
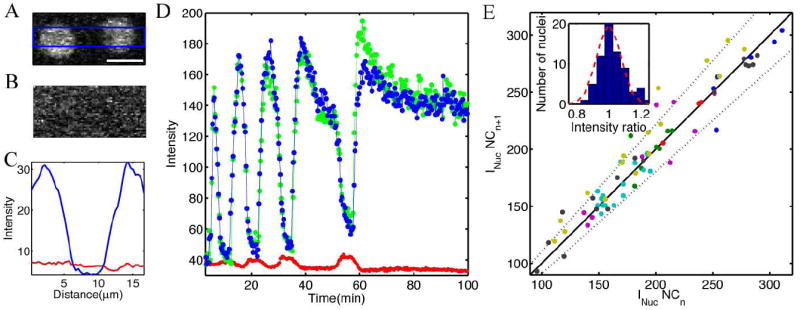
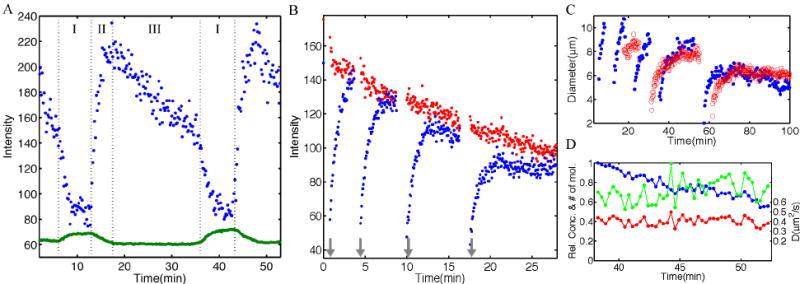
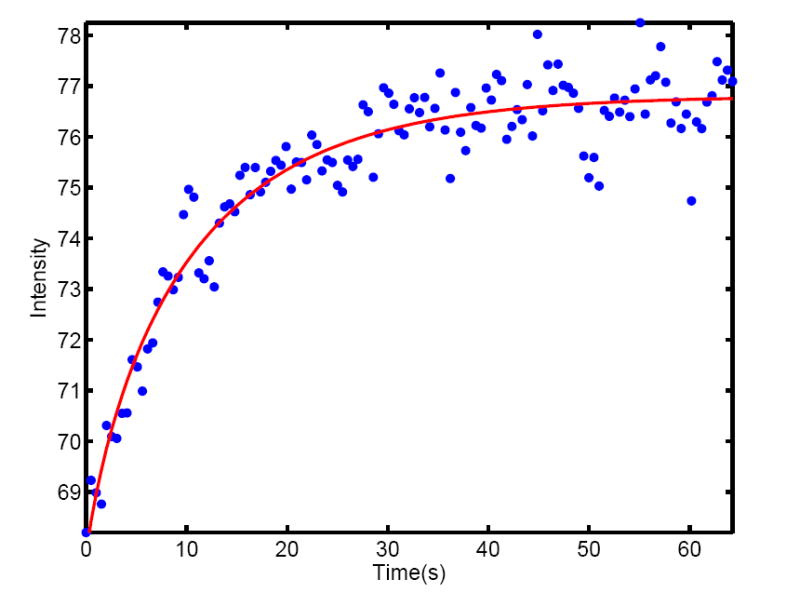
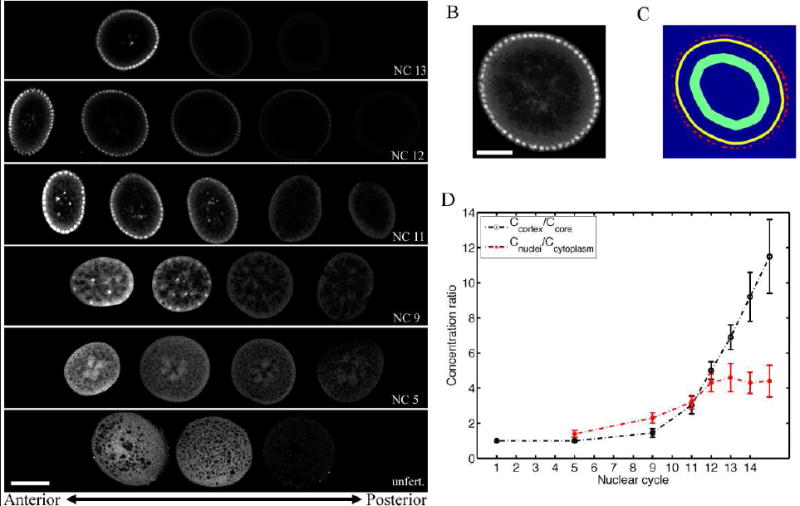
Patterning in multicellular organisms results from spatial gradients in morphogen concentration, but the dynamics of these gradients remain largely unexplored. We characterize, through in vivo optical imaging, the development and stability of the Bicoid morphogen gradient in Drosophila embryos that express a Bicoid-eGFP fusion protein. The gradient is established rapidly (approximately 1 hr after fertilization), with nuclear Bicoid concentration rising and falling during mitosis. Interphase levels result from a rapid equilibrium between Bicoid uptake and removal. Initial interphase concentration in nuclei in successive cycles is constant (+/-10%), demonstrating a form of gradient stability, but it subsequently decays by approximately 30%. Both direct photobleaching measurements and indirect estimates of Bicoid-eGFP diffusion constants (D < or = 1 microm(2)/s) provide a consistent picture of Bicoid transport on short ( approximately min) time scales but challenge traditional models of long-range gradient formation. A new model is presented emphasizing the possible role of nuclear dynamics in shaping and scaling the gradient.


Figures

FIG. 1
FIG. 1
Time-lapse movie of a Drosophila embryo expressing Bcd-GFP using two-photon microscopy. A Typical image stack during nuclear cycle 12 of three focal planes at 30 μm (top panel), 60 μm (mid panel) and 90 μm (bottom panel) below the top surface of the embryo. (Scale bar 100 μm.) B Six snapshots of a time-lapse movie of the anterior third of the mid-sagittal plane of a Drosophila embryo expressing Bcd-GFP. Each snapshot corresponds to a time point during interphases 9 to 14. Red arrow points to individual nucleus during interphase 9 when nuclei are deeper inside the egg. (Scale bar 60 μm.) C Bcd-GFP fluorescence profiles are extracted from two-photon time-lapse movies and projected on the egg’s AP-axis by sliding (in software) an averaging box of 10 × 10 μm2 size along the edge of the egg focussed at the mid-sagittal plane. Time is represented by colorcode. Time zero corresponds to oviposition. Imaging started 20 ± 15 min after oviposition. Inset: Nuclear Bcd gradients in nuclear cycles 11 (blue), 12 (green), 13 (red) and 14 (cyan) projected on the AP-axis in the anterior half of the embryo.
FIG. 2
FIG. 2
Comparison of Bcd profiles in Drosophila embryos expressing Bcd-GFP. (Embryos were formaldehyde fixed during nuclear cycle 14 and imaged at the mid-sagittal plane via confocal microscopy.) A Embryo stained with GFP antibodies.(Scale bar 100 μm.) B GFP autofluorescence for the same embryo as in A. C Nuclear layer obtained via image analysis software used to extract gradients from images A and B by sliding a circular averaging area (yellow circle) along the edge of the embryo images. D Extracted raw gradients from A and B projected on embryo AP-axis. Dashed line corresponds to location of yellow circle in C. E-H Scatter plots of fluorescence intensities extracted from Bcd profiles for different embryos. All profiles were normalized by a background subtraction and a scale factor (see Materials and Methods). Both dorsal and ventral profiles are shown in each panel. Colors represent individual embryos, red lines correspond to the average profile scatter, errorbars are for equal amounts of data points. Deviations of the compared profiles from the diagonal indicate a difference in the shape of the profile. For more information see Supplemental Data.
FIG. 3
FIG. 3
Bcd gradient stability. A Close up of two adjacent nuclei expressing Bcd-GFP fluorescence during mid-interphase 12. (Scale bar 10 μm.) B Same field of view as in A during mitosis 13. C Intensity profile of a mean horizontal cross-section through images in A (blue line, vertical average over blue rectangle in A) and B (red line, vertical average over entire image). D Typical nuclear and cytoplasmic development of Bcd-GFP concentration from nuclear cycles 10 to 14. Each data point corresponds to the concentration of a single nucleus at a given time point, computed as the mean intensity value over an area that corresponds to the smallest nuclear size encountered in over the entire time course (384 pixels). Blue and green traces follow two individual nuclei (located at ~ 50 μm distance from the anterior pole of the embryo), red curve corresponds to the average concentration in the interstitial space between the nuclei over a field of view of 50 × 50 μm (linear pixel dimension 0.20 μm/pixel). Time points are in 20 s intervals. E Scatter plot of peak nuclear intensities INuc, averaged over 1–5 time points, during nuclear cycle n versus nuclear cycle n+1. Different colors represent different embryos (N=7). For each embryo 1–8 nuclei were compared in nuclear cycles 10 to 14, resulting in a total of 77 data points. Black line with slope 1 corresponds to perfect intensity reproducibility across nuclear cycles. Dotted line corresponds to an accuracy of 10%. Inset: Bars: Histogram of observed intensity ratios in bins of width 5%. Dashed line: Results expected for Gaussian variations having the observed standard deviation of 7.9%.
FIG. 4
FIG. 4
Nuclear Bcd concentration dynamics. A Typical nuclear (blue) and cytoplasmic (green) Bcd-GFP concentration development during nuclear cycle 13. Three intervals correspond to: I) Nuclear envelope breakdown and diffusive nuclear Bcd-GFP release, II) rapid refilling of newly formed nuclei after mitosis, and III) interphase 13. B Fluorescence recovery after photobleaching of a single nucleus of a Bcd-GFP embryo during interval III of nuclear cycle 14. Blue curves are the recovery curves of a 4 times successively bleached nucleus, red curve is the concentration in a neighboring unbleached nucleus. Bleach pulses (10 – 15 s long) are indicated by gray arrows. Data points are in 4 s intervals. The time constants τ of exponential recovery fits are 60 s, 53 s, 52 s, 50 s, respectively for the 4 bleaching traces. The linear decay of the red curve is due to the increasing nuclear diameter during interphase which leads to an effective decrease in the nuclear Bcd-GFP concentration (see text). C Development of nuclear diameter from nuclear cycle 10 to 14. Blue and red data points correspond to two different embryos (blue corresponds to the data set of Figure 3A). The nuclear diameters at the end of interphase (averaged over 2 embryos) in nuclear cycles 10 to 14 are 10.0 μm, 10.5 μm, 9.2 μm, 8.2 μm, 6.5 μm, respectively. D Relative intensity (blue), relative number of molecules (green) and ratio of number of molecules to influx (red) as a function of time during nuclear cycle 13. Blue curve corresponds to average nuclear intensity I(t) represented by the blue trace in Figure 3D during interphase 13. Green curve corresponds to the product of I(t)rn3(t) where 2rn(t) is the nuclear diameter represented by the blue trace in C. Red curve corresponds to the product I(t)rn2(t). The right side of the vertical axis has been normalized to yield the cytoplasmic diffusion constant D=rn2Cin/3τCout, see text. To quantify the observation that I(t)rn2(t) is constant while I(t)rn3(t), we looked for linear correlations between these quantities and time; for I(t)rn3(t) the correlation (0.50) is highly significant (p = 0.0013), while for I(t)rn2(t) there is essentially no correlation (0.01, p = 0.93) – data sets for five embryos showed similar results.
FIG. 5
FIG. 5
Cortical diffusion constant measurements by fluorescence recovery after photobleaching. Recovery curve of bleached wild-type Drosophila embryos expressing Bcd-GFP during mitosis 13. Bleaching was done with a scanning two-photon microscope in a volume of 16 × 16 × 7 μm3 at the anterior tip of the egg. The bleaching pulse was generated by increasing the laser power 2-fold for a duration of 5 seconds. Data points are spaced 0.5 sec and shown as blue dots. Red curve represent a fit to the solution of the diffusion equation (see Methods), yielding a diffusion constant D = 0.27 ± 0.07 μm2/s.
FIG. 6
FIG. 6
Bcd concentration accumulation at the egg’s cortex. A Confocal images of hand-cut sections of formaldehyde-fixed wild-type Drosophila embryos. (Scale bar 100 μm.) Embryos have been stained with Bcd antibodies prior to cutting. Each row corresponds to a single embryo with sections ordered from anterior (left) to posterior (right) parts of the embryo during nuclear cycles 13, 12, 11, 9 and 5 (top to bottom). Bottom row shows a Bcd antibody staining of an unfertilized egg. B Typical anterior slice of hand-cut embryo stained with Bcd antibodies (close up of second slice from the right in 2nd row of A, scale bar 50 μm.). C Mask used to extract concentration averages in B. Red area corresponds to nuclear mask, yellow area corresponds to cytoplasmic mask and green area corresponds to core area. D Ratio of cytoplasmic Bcd concentration in the cortex and the inner core of the egg (black curve), and ratio of nuclear Bcd concentration and adjacent cytoplasmic Bcd concentration (red curve), both as a function of nuclear cycle. Concentrations are extracted from cut sections of A.

Comment in

References

    1. Ariizumi T, Asashima M. Control of the embryonic body plan by activin during amphibian development. Zoolog Sci. 1995;12:509–521. - PubMed
    1. Axelrod D, Koppel DE, Schlessinger J, Elson E, Webb WW. Mobility measurement by analysis of fluorescence photobleaching recovery kinetics. Biophys J. 1976;16:1055–1069. - PMC - PubMed
    1. Barolo S, Carver LA, Posakony JW. GFP and beta-galactosidase transformation vectors for promoter/enhancer analysis in Drosophila. Biotechniques. 2000;29:726–732. - PubMed
    1. Berg HC, Purcell EM. Physics of chemoreception. Biohys J. 1977;20:193–219. - PMC - PubMed
    1. Brown EB, Wu ES, Zipfel W, Webb WW. Measurement of molecular diffusion in solution by multiphoton fluorescence photobleaching recovery. Biophys J. 1999;77:2837–2849. - PMC - PubMed

Publication types

MeSH terms