. 2007 Jul 13;130(1):153-64.
doi: 10.1016/j.cell.2007.05.025.

Probing the limits to positional information

Affiliations

Probing the limits to positional information

Thomas Gregor et al. Cell. .

Abstract

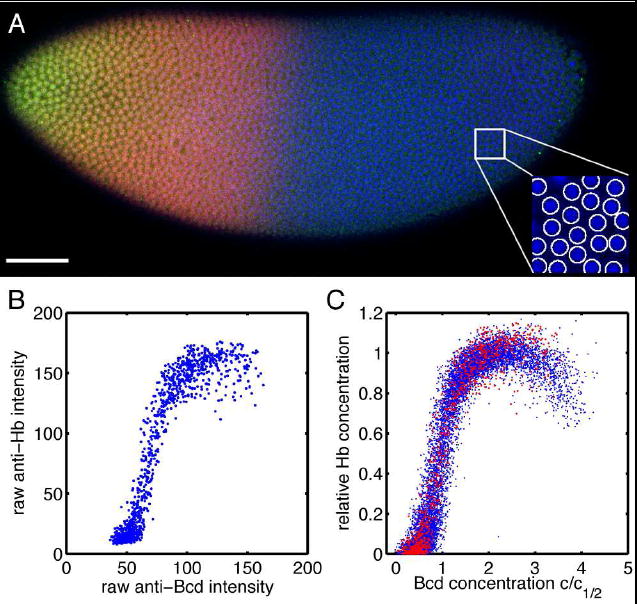
The reproducibility and precision of biological patterning is limited by the accuracy with which concentration profiles of morphogen molecules can be established and read out by their targets. We consider four measures of precision for the Bicoid morphogen in the Drosophila embryo: the concentration differences that distinguish neighboring cells, the limits set by the random arrival of Bicoid molecules at their targets (which depends on absolute concentration), the noise in readout of Bicoid by the activation of Hunchback, and the reproducibility of Bicoid concentration at corresponding positions in multiple embryos. We show, through a combination of different experiments, that all of these quantities are approximately 10%. This agreement among different measures of accuracy indicates that the embryo is not faced with noisy input signals and readout mechanisms; rather, the system exerts precise control over absolute concentrations and responds reliably to small concentration differences, approaching the limits set by basic physical principles.


Figures

FIG. 1
FIG. 1
Schematic of the readout problem for the Bicoid gradient. At left, the conventional picture. A smooth gradient of Bcd concentration is translated into a sharp boundary of Hb expression because Bcd acts as a cooperative activator of the hb gene. Although intended as a sketch, the different curves have been drawn to reflect what is known about the scales on which both the Bcd and Hb concentrations vary. Note that neighboring cells along the anterior-posterior axis experience Bcd concentrations that are very similar (differing by ~ 10%, as explained in the text), yet the resulting levels of Hb expression are very different. At right, we consider a larger number of cells in the mid-embryo region where Hb expression switches from high to low values. From direct experiments on simpler systems we know that, even when the concentrations of transcription factors are fixed, the resulting levels of gene expression will fluctuate (Elowitz et al 2002; Raser & O’Shea 2004), and there are physical limits to how much this noise can be reduced (Bialek & Setayeshgar 2005, 2006). If the noise is low, such that a scatter plot of Hb expression vs Bcd concentration is relatively tight, then the qualitative picture of a sharp Hb expression boundary is perturbed only slightly. If the noise is large, so that there is considerable scatter in the relationship between Bcd and Hb measured for individual cells, then the sharp Hb expression boundary will exist only on average, and not along individual rows in individual embryos.
FIG. 2
FIG. 2
Absolute concentration of Bcd. A: Scanning two-photon microscope image of a Drosophila embryo expressing a Bcd-GFP fusion protein (Gregor et al 2007); scale bar 50 μm. The embryo is bathed in a solution of GFP with concentration 36 nM. We identify individual nuclei and estimate the mean Bcd-GFP concentration by the ratio of fluorescence intensity to this standard. B: Apparent Bcd-GFP concentrations in each visible nucleus plotted vs. anterior-posterior position x (reference line in A) in units of the egg length L; red and blue points are dorsal and ventral, respectively. Repeating the same experiments on wild type flies which do not express GFP, we find a background fluorescence level shown by the black points with error bars (standard deviation across four embryos). In the inset we subtract the mean background level to give our best estimate of the actual Bcd-GFP concentration in the nuclei near the midpoint of the embryo. Points with error bars show the nominal background, now at zero on average.
FIG. 3
FIG. 3
Hb vs. Bcd concentrations from fixed and stained embryos. A: Scanning confocal microscope image of a Drosophila embryo in early nuclear cycle 14, stained for DNA (blue), Hb (red) and Bcd (green); scale bar 50 μm. Inset (28×28 μm2) shows how DNA staining allows for automatic detection of nuclei (see Methods). B: Scatter plot of Hb vs Bcd immunofluorescent staining levels from 1299 identified nuclei in a single embryo. C: Scatter plot of Hb vs Bcd concentration from a total of 13,366 nuclei in 9 embryos, normalized (see Methods). Data from the single embryo in B are highlighted.
FIG. 4
FIG. 4
Input/output relations and noise. A: Mean input/output relations for 9 embryos. Curves show the mean level of Hb expression as a function of the Bcd concentration, where we use a logarithmic axis to provide a clearer view of the steep, sigmoidal nonlinearity. Points and error bars show, respectively, the mean Hb level and standard deviation of the output noise for one of the embryos. Inset shows mean Hb output (points) and standard errors of the mean (error bars) when data from all embryos are pooled. The mean response is consistent with the Hill relationship, Equation (4), with n = 5, corresponding to a model in which five Bcd molecules bind cooperatively to activate Hb expression (red line). In comparison, Hill relations with n = 3 or n = 7 provide substantially poorer fits to the data (green lines). B: Standard deviations of Hb levels for nuclei with given Bcd levels. C: Translating the output noise of (B) into an equivalent input noise, following Equation (6). Blue dots are data from 9 embryos, green line with error bars is an estimate of the noise in our measurements (see Methods), and red circles with error bars are results after correcting for measurement noise. D: Correlation function of Hb output noise, normalized by output noise variance, as a function of distance r measured in units of the mean spacing between neighboring nuclei. Lines are results for four individual embryos, points and error bars are the mean and standard deviation of these curves. We have checked that the dominant sources of measurement noise are uncorrelated between neighboring nuclei. The large difference between r = 0 and r = arises largely from this measurement noise. Inset shows the same data on a logarithmic scale, with a fit to an exponential decay C ∝ exp(−r/ξ); the correlation length ξ/ℓ = 5 ± 1.
FIG. 5
FIG. 5
Reproducibility of the Bcd profile in live embryos. A: Bcd-GFP profiles of 15 embryos. Each dot represents the average concentration in a single nucleus at the mid-sagittal plane of the embryo (on average 70 nuclei per embryo). All nuclei from all embryos are binned in 50 bins, over which the mean and standard deviation were computed (black points with error bars). Scale at left shows raw fluorescence intensity, and at right we show concentration in nM, with background subtracted, as in Figure 2. B: For each bin from A, standard deviations divided by the mean as a function of fractional egg length (blue); errorbars are computed by bootstrapping with 8 embryos. Grey and black lines show estimated contributions to measurement noise (see Methods). C: Variability of Bcd profiles translated into an effective rms error σ(x) in positional readout, as in Equation (9); error bars from bootstrapping. Green circles are obtained by correcting for measurement noise. D: Bcd-GFP profiles of 3 embryos expressing 2 copies of Bcd-GFP (red) and of 3 embryos expressing 1 copy of Bcd-GFP (blue). Each dot represents a single nucleus as in A. In green, we show fluorescence intensities from 1X embryos multiplied by two, after background correction. E: 2X vs. 1X Bcd-GFP profiles–no normalization, all possible permutations (blue dots). Red line represents a linear fit to all data points, (Inuc2X=1.95Inuc1X41.8), where the offset corresponds to the imaging background.
FIG. 6
FIG. 6
Reproducibility of the Bcd profile in fixed and stained embryos. Upper panels: Data on Bcd concentration from Houchmandzadeh et al (2002). A: Normalization based on maximum and minimum values of staining intensity. B: Normalization to minimize χ2, as in Equation (10). Note that these are the same raw data, but with the normalization to minimize χ2 the profiles appear much more reproducible, especially near the midpoint of the anterior-posterior axis. This is quantified in C, where we show the standard deviation of the concentration divided by the mean, as in Figure 5B, for the min/max normalization (blue) and the normalization to minimize χ2 (green). D: Equivalent root-mean-square error in translating morphogen profiles into positional information, from Equation (9). Data on Bcd from Houchmandzadeh et al (2002), with min/max normalization (blue) and normalization to minimize χ2 (green); data on Bcd (red) and Hb (cyan) from our experiments (see Methods). C: Variability of Bcd profiles translated into an effective rms error σ(x) in positional readout, as in Equation (9); error bars from bootstrapping. Green circles are obtained by correcting for measurement noise.

Comment in

References

    1. Barlow HB. Critical limiting factors in the design of the eye and visual cortex. Proc R Soc Lond Ser B. 1981;212:1–34. - PubMed
    1. Berg HC, Purcell EM. Physics of chemoreception. Biohys J. 1977;20:193–219. - PMC - PubMed
    1. Bialek W. Physical limits to sensation and perception. Ann Rev Biophys Biophys Chem. 1987;16:455–478. - PubMed
    1. Bialek W. Thinking about the brain. In: Flyvbjerg H, Jülicher F, Ormos P, David F, editors. Physics of Biomolecules and Cells: Les Houches Session LXXV. EDP Sciences; Les Ulis: Springer-Verlag; Berlin: 2002. pp. 485–577.
    1. Bialek W, Setayeshgar S. Physical limits to biochemical signaling. Proc Nat’l Acad Sci (USA) 2005;102:10040–10045. - PMC - PubMed

Publication types

MeSH terms