. 2007 Jul 10;8 Suppl 1(Suppl 1):S4.
doi: 10.1186/1471-2121-8-S1-S4.

Model based dynamics analysis in live cell microtubule images

Affiliations

Model based dynamics analysis in live cell microtubule images

Alphan Altinok et al. BMC Cell Biol. .

Abstract

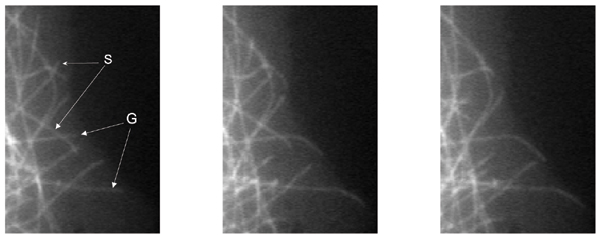
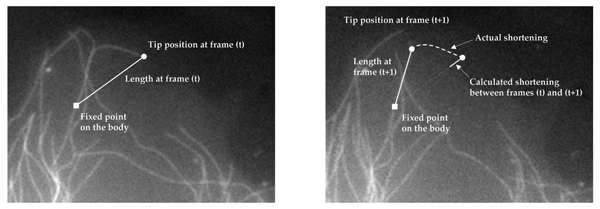
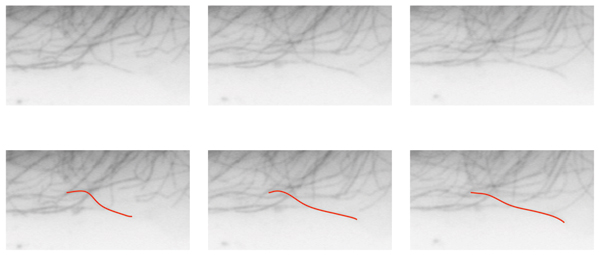
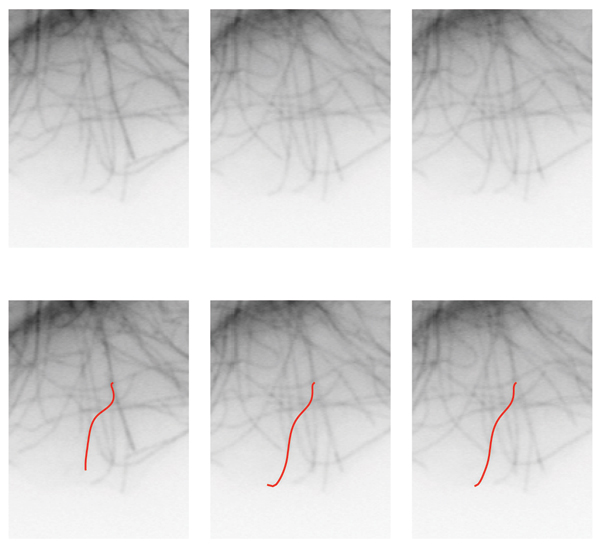
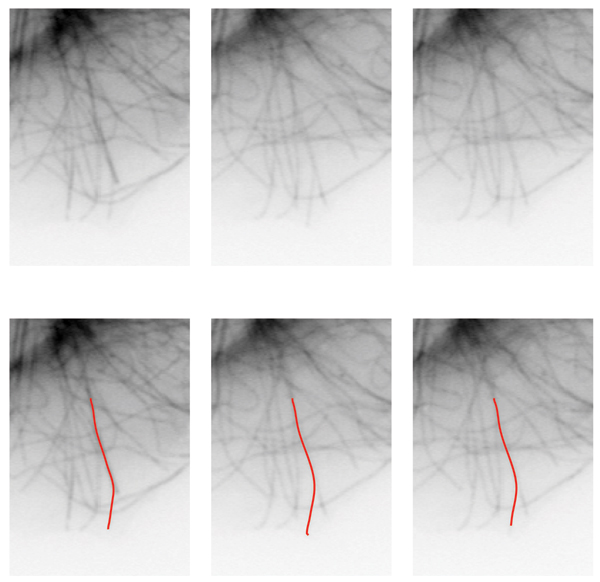
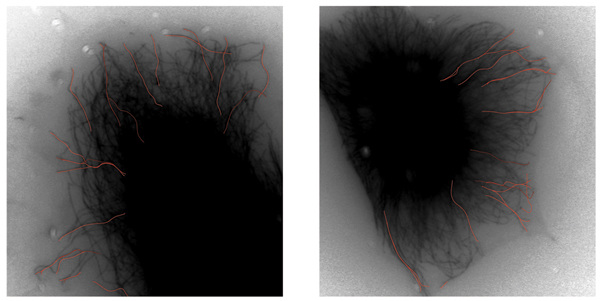
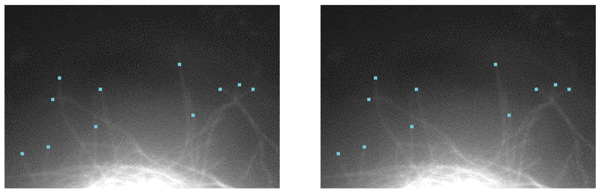
Background: The dynamic growing and shortening behaviors of microtubules are central to the fundamental roles played by microtubules in essentially all eukaryotic cells. Traditionally, microtubule behavior is quantified by manually tracking individual microtubules in time-lapse images under various experimental conditions. Manual analysis is laborious, approximate, and often offers limited analytical capability in extracting potentially valuable information from the data.

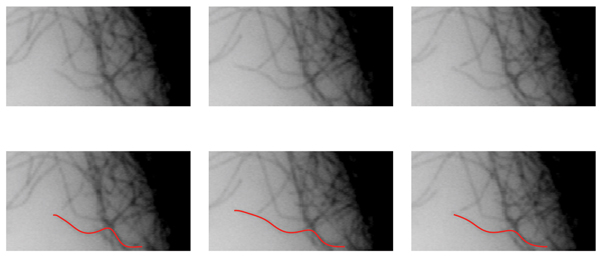
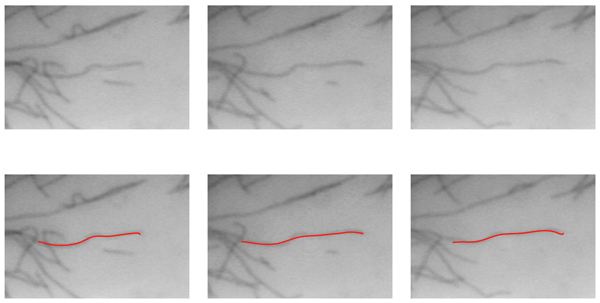
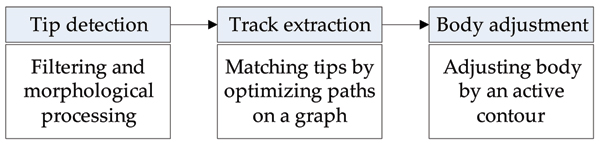
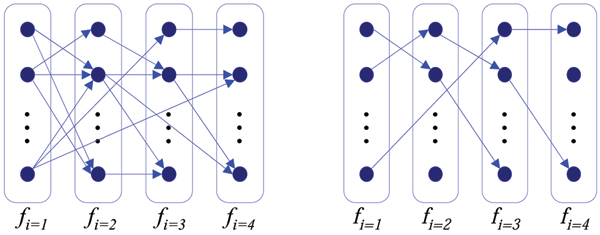
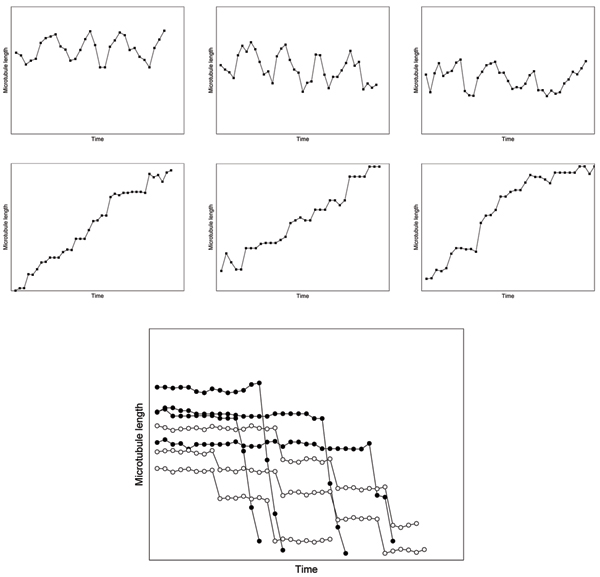
Results: In this work, we present computer vision and machine-learning based methods for extracting novel dynamics information from time-lapse images. Using actual microtubule data, we estimate statistical models of microtubule behavior that are highly effective in identifying common and distinct characteristics of microtubule dynamic behavior.

Conclusion: Computational methods provide powerful analytical capabilities in addition to traditional analysis methods for studying microtubule dynamic behavior. Novel capabilities, such as building and querying microtubule image databases, are introduced to quantify and analyze microtubule dynamic behavior.


Figures

Figure 1
Figure 1
Consecutive time-lapse images of MTs taken at 4 sec. intervals. Examples of growing (G) and shortening (S) MTs are marked. Tip locations of these MTs are manually tracked over time by marking on consecutive frames to calculate the growth and shortening statistics.
Figure 2
Figure 2
In each frame, length of a MT is estimated by the Euclidean distance between a fixed point on the MT, called the origin, and the MT tip, (a). Shortening length between two consecutive frames is calculated as the difference of respective lengths. This estimate may not reflect the actual shortening as shown in (b).
Figure 3
Figure 3
Example tracking results. Original frames are shown in (a – c). Computed MT bodies in corresponding frames are superimposed in (d – f). While the MT body trace was swayed by an intersecting MT, consistent estimation of the body trace is sufficient for quantifying the growth or shortening at the MT tip.
Figure 4
Figure 4
Example tracking results. Original frames are shown in (a – c). Computed MT bodies in corresponding frames are superimposed in (d – f).
Figure 5
Figure 5
Example tracking results. Original frames are shown in (a – c). Computed MT bodies in corresponding frames are superimposed in (d – f). This example displays the small variations on the estimated origin. As a consequence of the minus end estimation procedure, this variation is the main component of the errors in length computation.
Figure 6
Figure 6
Example tracking results. Original frames are shown in (a – c). Computed MT bodies in corresponding frames are superimposed in (d – f).
Figure 7
Figure 7
Example tracking results. Original frames are shown in (a – c). Computed MT bodies in corresponding frames are superimposed in (d – f).
Figure 8
Figure 8
Tracked MTs superimposed on selected cells from EC5. Tracks were evaluated for their behavioral association to models representing EC5 by calculating p(track|EC5). Resulting probabilities were quantized to four categories to aid visibility. Darker tracks exhibit lower association with EC5, while brighter tracks are indicative of typical behaviors captured by models.
Figure 9
Figure 9
Example tip detection results in consecutive MT frames. Tip detection algorithm is sensitive to the proximity of the neighboring MTs. For example, tips that are close to MT intersections are eliminated due to uncertainty.
Figure 10
Figure 10
Conceptual overview of MT tracking procedure.
Figure 11
Figure 11
Example diagram of constructed graph, G = (V, E), across frames, fi, is shown in (a). A sample solution is shown in (b), where each path corresponds to a MT track.
Figure 12
Figure 12
Example life history plots from hypothetical MTs showing different behaviors. Life histories were inspired by [33]. Individual MTs in the top undergo several length excursions, while the MTs in the middle row exhibit an overall growth tendency. The bottom chart shows individual MTs, distinguished by filled and open circles, which are superimposed on the time axis for visual comparison. While both groups of MTs display shortening, the group indicated by the open circles shorten gradually as compared with the rest of the MTs.

References

    1. Alberts B, Johnson A, Lewis J, Raff M, Roberts K, Walter P. Molecular Biology of the Cell. Garland Scientific; 2002.
    1. Feinstein SC, Wilson L. Inability of tau to properly regulate neuronal microtubule dynamics: a loss-of-function mechanism by which tau might mediate neuronal cell death. Biochim Biophys Acta. 2005;1739:268–279. - PubMed
    1. Goncalves A, Braguer D, Kamath K, Martello L, Briand C, Horwitz S, Wilson L, Jordan MA. Resistance to Taxol in lung cancer cells associated with increased microtubule dynamics. PNAS. 2001;98:11737–11742. - PMC - PubMed
    1. Walker RA, O'Brien ET, Pryer NK, Soboeiro MF, Voter WA, Erickson HP, Salmon ED. Dynamic instability of individual microtubules analyzed by video light microscopy: rate constants and transition frequencies. J Cell Biol. 1988;107:1437–1448. - PMC - PubMed
    1. Bunker JM, Wilson L, Jordan MA, Feinstein SC. Modulation of Microtubule Dynamics by Tau in Living Cells: Implications for Development and Neurodegeneration. Molecular Biology of the Cell. 2004;15:2720–2728. - PMC - PubMed

Publication types

Substances

LinkOut - more resources