. 2007 Jul 16:8:10.
doi: 10.1186/1471-2172-8-10.

Modulation of microglial/macrophage activation by macrophage inhibitory factor (TKP) or tuftsin (TKPR) attenuates the disease course of experimental autoimmune encephalomyelitis

Affiliations

Modulation of microglial/macrophage activation by macrophage inhibitory factor (TKP) or tuftsin (TKPR) attenuates the disease course of experimental autoimmune encephalomyelitis

Madhuri Bhasin et al. BMC Immunol. .

Abstract

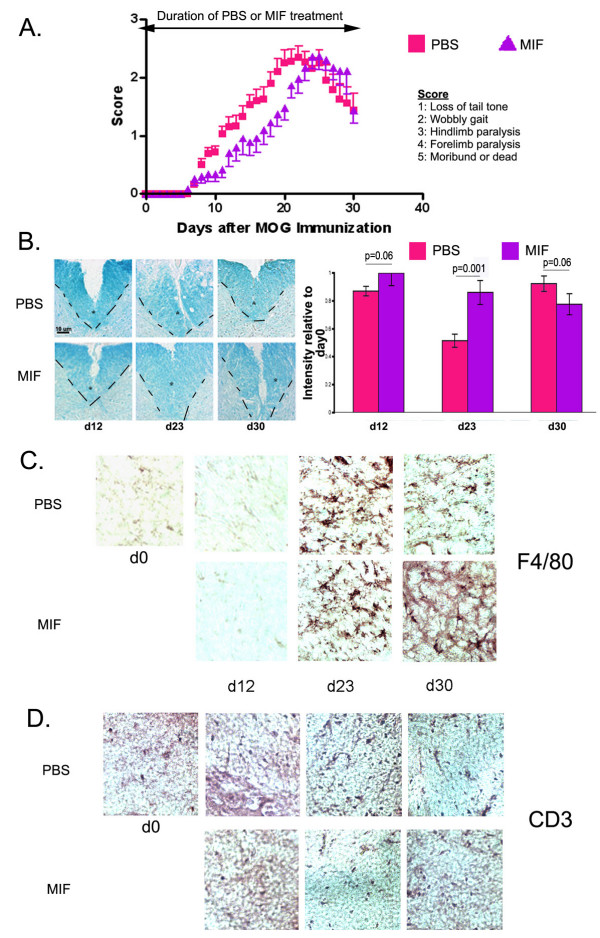
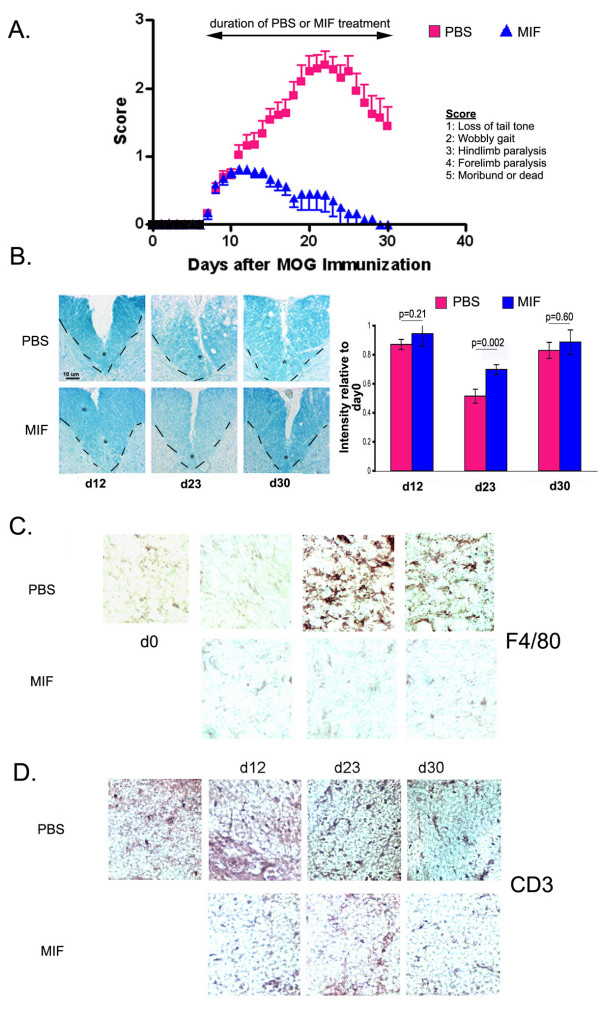
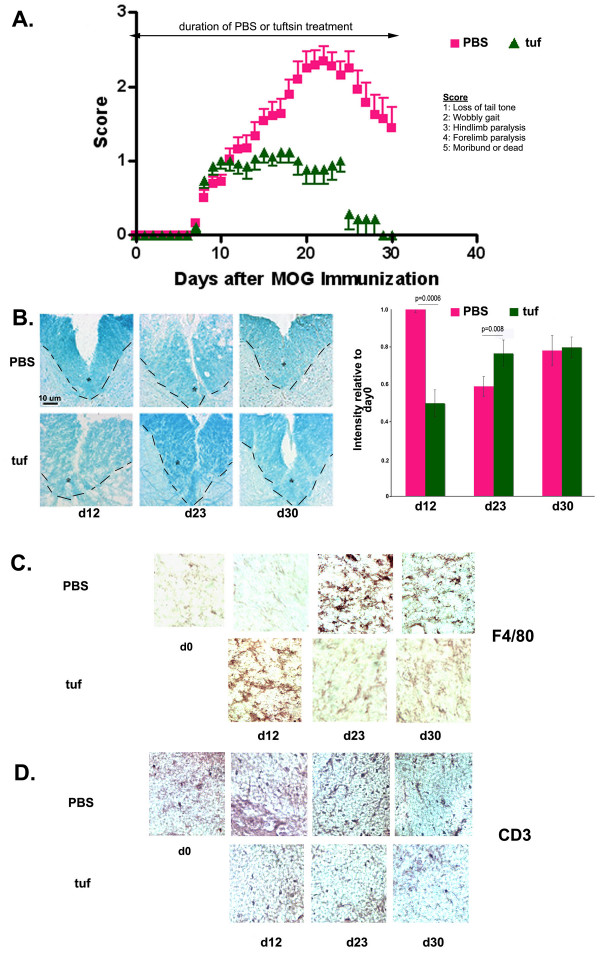
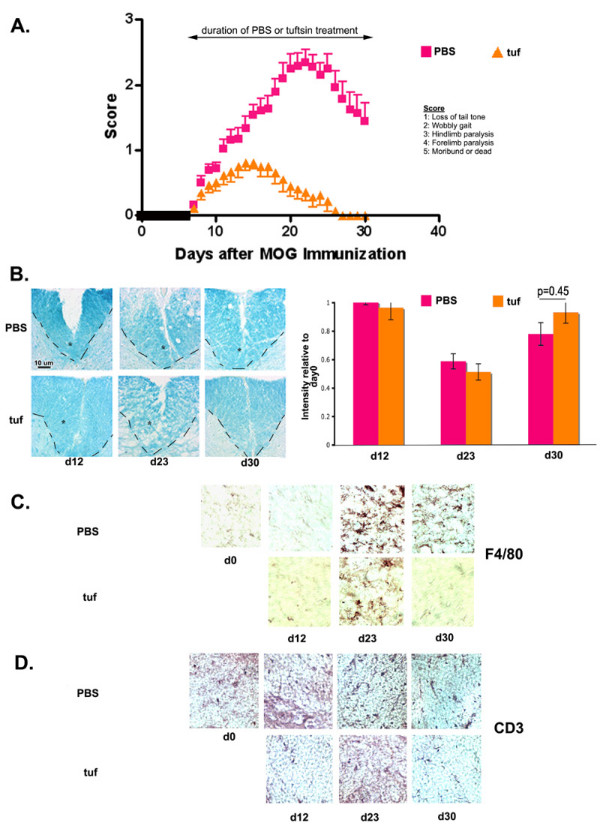
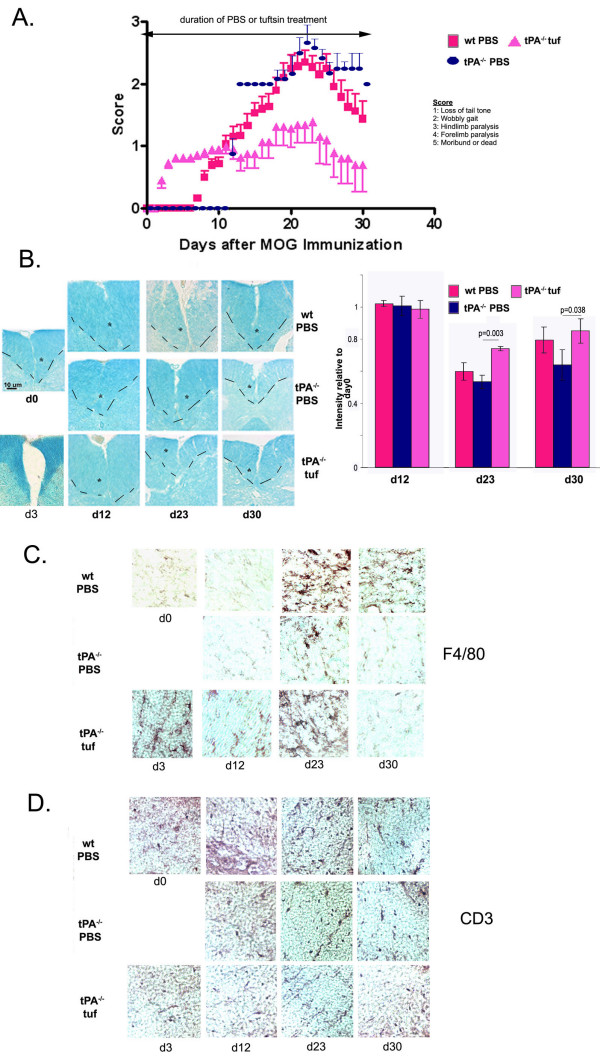
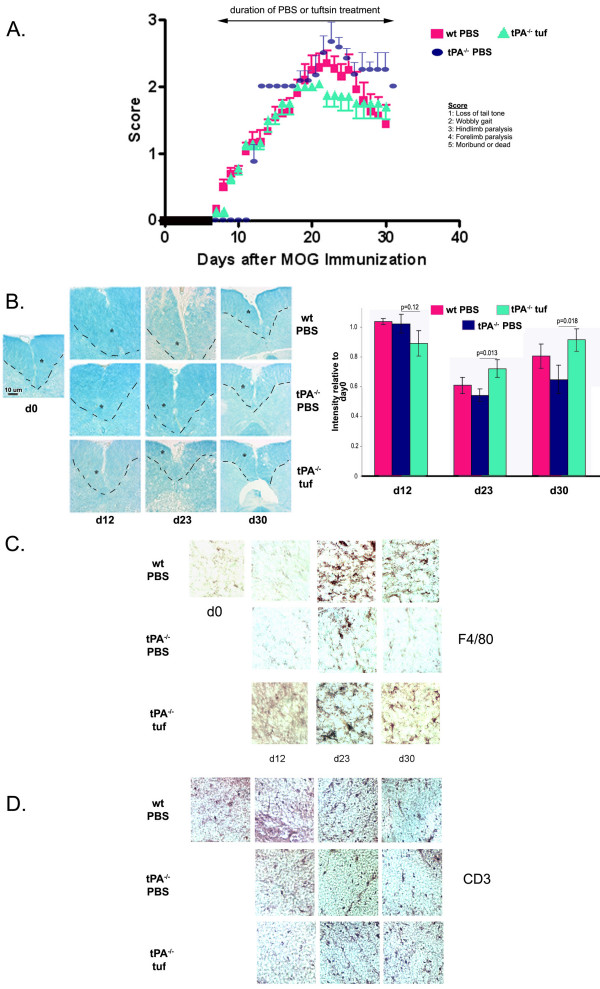
Background: Myelin Oligodendrocyte Glycoprotein (MOG)-induced experimental autoimmune encephalomyelitis (EAE) is the most commonly used mouse model for multiple sclerosis (MS). During the of progression of EAE, microglia, the immunocompetent cells of the brain, become activated and accumulate around demyelinated lesions. Microglial activation is mediated by the extracellular protease tissue Plasminogen Activator (tPA), and mice lacking tPA display altered EAE progression. In this study, we have used pharmacological inhibitors and stimulators of microglial/macrophage activation to examine the temporal requirement for microglial activation in EAE progression and to determine whether such approaches might potentially be of therapeutic value.

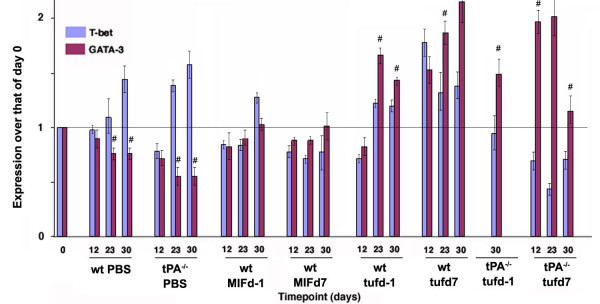
Results: Intervention using the tripeptide macrophage/microglia inhibitory factor MIF (TKP) and the tetrapeptide macrophage/microglial stimulator tuftsin (TKPR) attenuated EAE symptoms and revealed that the timing of macrophage/microglial activation is critical for the clinical outcome of EAE. We show that the disease progression can potentially be manipulated favorably at early stages by altering the timing of microglial activation, which in turn alters the systemic immune response to favor upregulation of T helper cell 2 genes that promote recovery from EAE.

Conclusion: Preventative and therapeutic modulation of macrophage/microglial activity significantly alters the outcome of EAE at symptomatic stages. Specific molecular targets have been identified that represent potential avenues of exploration for the treatment and prevention of MS.


Figures

Figure 1
Figure 1
Prophylactic MIF infusion does not alter onset, severity or recovery of EAE. (A) Wt mice were infused with MIF for 30 days, starting one day prior to EAE induction. The mice were weighed and scored daily for symptoms using the severity scale outlined in Methods. Daily scores were averaged. PBS n = 18; MIF d-1 n = 12. Wilcoxon test showed no statistically significant differences in onset, severity or recovery, but the progression of the disease is more delayed. (B) Frozen spinal cord sections were stained with Luxol Fast Blue to show areas of myelination. The dashed line and the asterisk demarcate the ventral column of the spinal cord. The intensity of luxol fast blue staining within the ventral column was quantified using the NIH Image freeware and was normalized to day 0 staining. Background staining was subtracted. (C) Immunohistochemistry for activated macrophage/microglial cells using F4/80 in frozen spinal cord sections. (D) Immunohistochemistry for infiltrating T cells using an anti-CD3 antibody.
Figure 2
Figure 2
Therapeutic MIF infusion severely abrogates the course of EAE. (A) No statistically significant difference was observed in EAE onset between wt PBS and wt MIFd7 mice. However, the symptom severity was dramatically decreased (p = 0.0005) in wt MIFd7 compared to wt PBS; recovery was complete (p = 0.0005). wt PBS n = 18; wt MIF d7 n = 11. (B) Luxol Fast Blue staining shows very little demyelination at day 23 in wt MIFd7 mice. The dashed line and the asterisk demarcate the ventral column of the spinal cord. The intensity of luxol fast blue staining within the ventral column was quantified using the NIH Image freeware and was normalized to day 0 staining. Background staining was subtracted. (C) Immunohistochemistry for reactive macrophages/microglia using antibody against F4/80. (D) Immunohistochemistry for CD3+ T cells.
Figure 3
Figure 3
Prophylactic administration of Tuftsin in wild-type mice results in a dampened disease course. (A) Disease onset in wt tufd-1 mice does not differ from wt PBS mice. Severity is dramatically decreased (p = 0.008) and recovery is complete (p = 0.016). wt PBS n= 18, wt tufd-1 n = 13. (B) Luxol fast blue histological stain reveals levels of myelination. The dashed line and the asterisk demarcate the ventral column of the spinal cord. The intensity of luxol fast blue staining within the ventral column was quantified using the NIH Image freeware and was normalized to day 0 staining. Background staining was subtracted. (C) Reactive macrophages/microglia are visible in the coronal sections of experimental mice at different timepoints. (D) Infiltrating T cells were detected by immunohistochemistry using an anti-CD3 antibody.
Figure 4
Figure 4
Therapeutic use of Tuftsin in wt mice results in a severely abrogated course of disease. (A) Disease onset is the same in wt tufd7 mice and wt PBS mice. Severity is strongly dampened (p = 0.004) and recovery is complete (p = 0.0002). wt PBS n= 18, wt tufd7 n = 13. (B) Levels of myelination are visualized using luxol fast blue. The dashed line and the asterisk demarcate the ventral column of the spinal cord. The intensity of luxol fast blue staining within the ventral column was quantified using the NIH Image freeware and was normalized to day 0 staining. Background staining was subtracted. (C) Macrophage/microglial activation is visualized with F4/80 staining. (D) Immunohistochemistry for infiltrating T cells using an anti-CD3 antibody.
Figure 5
Figure 5
Prophylactic tuftsin infusion at day -1 in tPA-/- mice results in a dramatically early onset of EAE. (A) Disease onset occurs at day 3 in tPA-/- tufd-1 mice, much earlier than wt PBS (p = 0.03). Severity is dramatically decreased (p = 0.03) and recovery remained at a low level (p = 0.08). wt PBS n= 18, tPA-/- tufd-1 n = 11. (B) Luxol Fast Blue staining to visualize levels of demyelination. The dashed line and the asterisk demarcate the ventral column of the spinal cord. The intensity of luxol fast blue staining within the ventral column was quantified using the NIH Image freeware and was normalized to day 0 staining. Background staining was subtracted. (C) F4/80 immunohistochemistry for activated macrophages/microglia. (D) Immunohistochemistry for infiltrating T cells using an anti-CD3 antibody.
Figure 6
Figure 6
Therapeutic administration of tuftsin in tPA-/- mice does not alter onset, severity or recovery of EAE. (A) Wilcoxon test showed no significant difference in EAE parameters (p > 0.05). wt PBS n = 18, tPA-/- tufd7 n = 7. (B) Demyelination is visualized by luxol fast blue. The dashed line and the asterisk demarcate the ventral column of the spinal cord. The intensity of luxol fast blue staining within the ventral column was quantified using the NIH Image freeware and was normalized to day 0 staining. Background staining was subtracted. (C) F4/80+-reactive macrophages/microglia detected by immunohistochemistry. (D) Immunohistochemistry for T cells using an anti-CD3 antibody.
Figure 7
Figure 7
Quantification of T-bet (Th1 transcription factor) and GATA-3 (Th2 transcription factor) expression. Real time RT-PCR was performed on RNA from spinal cord homogenates extracted after the different treatments with MIF and tuftsin at various timepoints. Expression levels obtained for T-bet and GATA-3 were normalized against actin levels at the same timepoint in the same sample. #, denotes significant differences between the two (p < 0.05) groups for the specific treatment and timepoint.

Similar articles

Cited by

References

    1. Mor F, Kantorowitz M, Cohen IR. The dominant and the cryptic T cell repertoire to myelin basic protein in the Lewis rat. J Neurosci Res. 1996;45:670–679. doi: 10.1002/(SICI)1097-4547(19960915)45:6<670::AID-JNR3>3.0.CO;2-5. - DOI - PubMed
    1. Behi ME, Dubucquoi S, Lefranc D, Zephir H, De Seze J, Vermersch P, Prin L. New insights into cell responses involved in experimental autoimmune encephalomyelitis and multiple sclerosis. Immunol Lett. 2005;96:11–26. doi: 10.1016/j.imlet.2004.07.017. - DOI - PubMed
    1. Olivares-Villagómez D, Wensky AK, Wang Y, Lafaille JJ. Repertoire Requirements of CD4+ T Cells That Prevent Spontaneous Autoimmune Encephalomyelitis. J Immunol. 2000;164:5499–5507. - PubMed
    1. Chen X, Oppenheim JJ, Winkler-Pickett RT, Ortaldo JR, Howard OM. Glucocorticoid amplifies IL-2-dependent expansion of functional FoxP3(+)CD4(+)CD25(+) T regulatory cells in vivo and enhances their capacity to suppress EAE. Eur J Immunol. 2006;36(8):2139-49:2139–2149. doi: 10.1002/eji.200635873. - DOI - PubMed
    1. Yoles E, Hauben E, Palgi O, Agranov E, Gothilf A, Cohen A, Kuchroo V, Cohen IR, Weiner H, Schwartz M. Protective autoimmunity is a physiological response to CNS trauma. J Neurosci. 2001;21:3740–3748. - PMC - PubMed

Publication types

MeSH terms

LinkOut - more resources