. 2007 Jul 16:6:49.
doi: 10.1186/1476-4598-6-49.

RASSF1A promoter methylation and expression analysis in normal and neoplastic kidney indicates a role in early tumorigenesis

Affiliations

RASSF1A promoter methylation and expression analysis in normal and neoplastic kidney indicates a role in early tumorigenesis

Inga Peters et al. Mol Cancer. .

Abstract

Background: Epigenetic silencing of the RAS association domain family 1A (RASSF1A) tumor suppressor gene promoter has been demonstrated in renal cell carcinoma (RCC) as a result of promoter hypermethylation. Contradictory results have been reported for RASSF1A methylation in normal kidney, thus it is not clear whether a significant difference between RASSF1A methylation in normal and tumor cells of the kidney exists. Moreover, RASSF1A expression has not been characterized in tumors or normal tissue as yet.

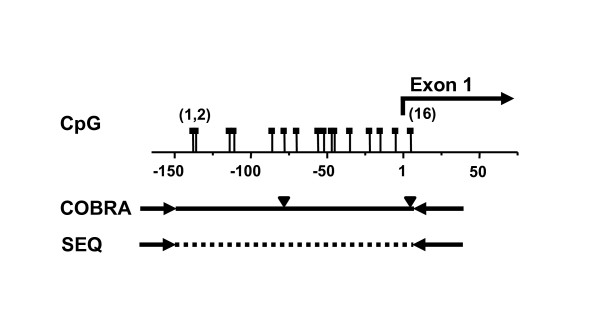
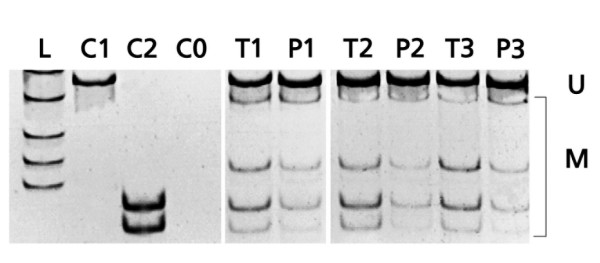
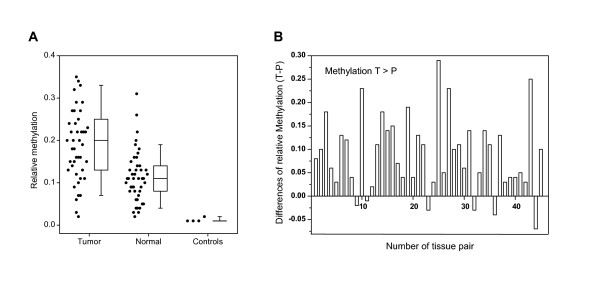
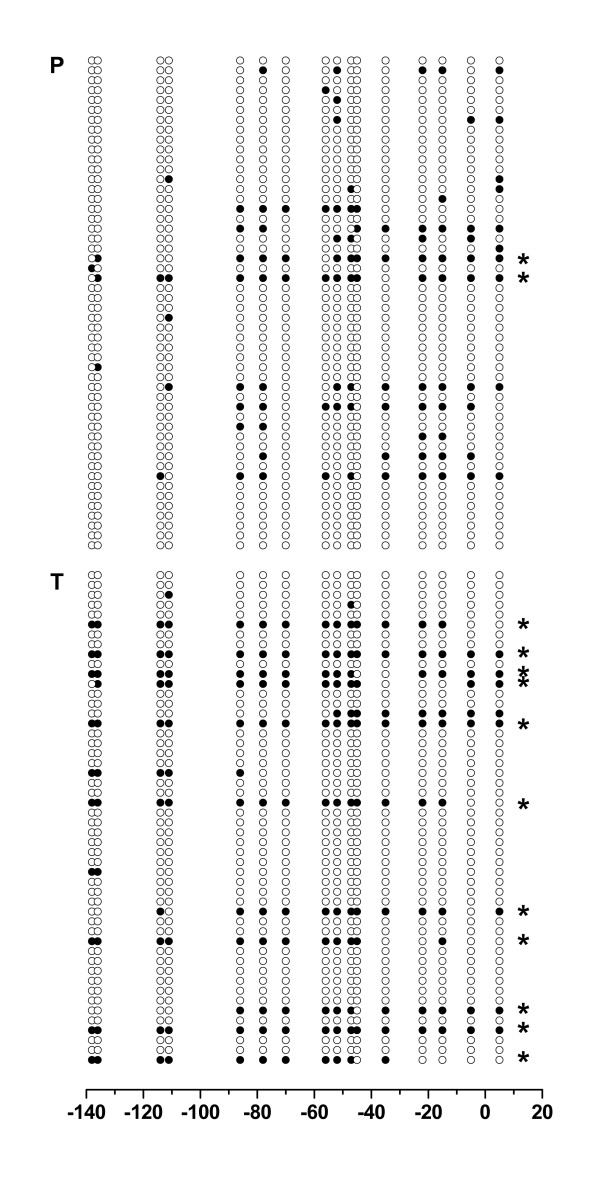
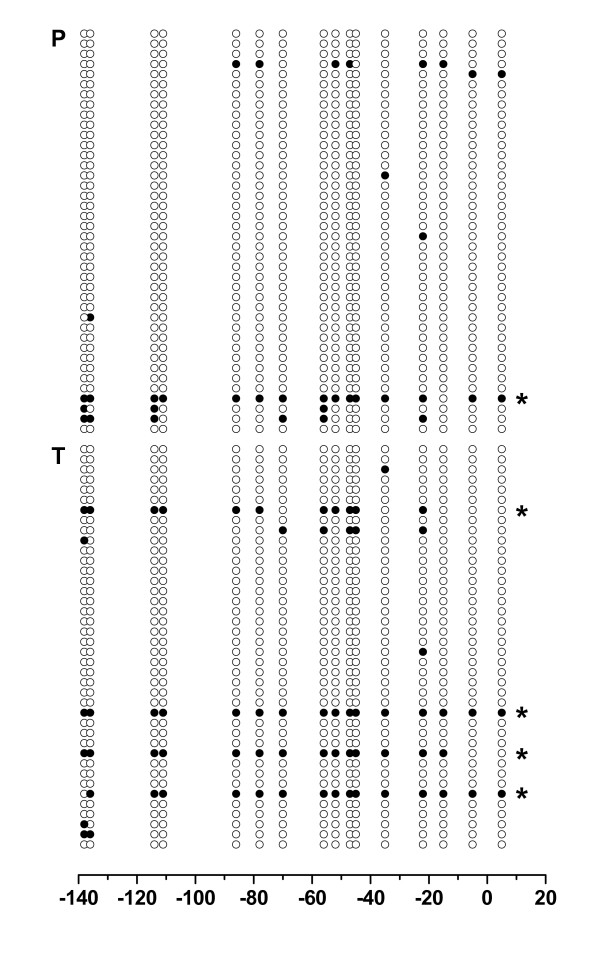
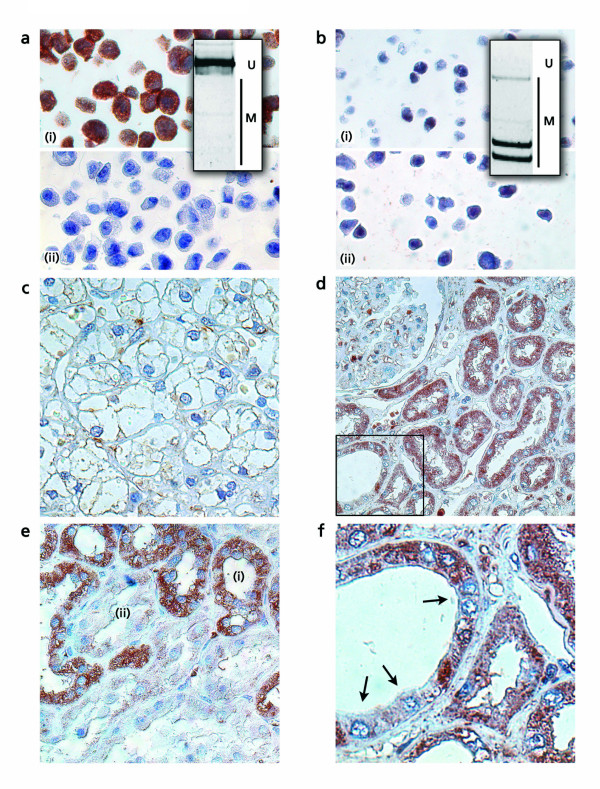
Results: Using combined bisulfite restriction analysis (COBRA) we compared RASSF1A methylation in 90 paired tissue samples obtained from primary kidney tumors and corresponding normal tissue. Bisulfite sequence analysis was carried out using both pooled amplicons from the tumor and normal tissue groups and subclones obtained from a single tissue pair. Expression of RASSF1A was analyzed by the use of tissue arrays and immunohistochemistry. We found significantly increased methylation in tumor samples (mean methylation, 20%) compared to corresponding normal tissues (mean methylation, 11%; P < 0.001). Densely methylated sequences were found both in pooled and individual sequences of normal tissue. Immunohistochemical analysis revealed a significant reduced expression of RASSF1A in most of the tumor samples. Heterogeneous expression patterns of RASSF1A were detected in a subgroup of histologically normal tubular epithelia.

Conclusion: Our methylation and expression data support the hypothesis that RASSF1A is involved in early tumorigenesis of renal cell carcinoma.


Figures

Figure 1
Figure 1
Analyzed promoter region of the RASSF1A gene. CpG sites in the promoter region of the RASSF1A gene analyzed by combined bisulfite restriction analysis (COBRA) and bisulfite sequence analysis. Numbers refer to the position of transcription start site while bracketed numbers indicate CpG sites. Solid triangles show TaqI restrictions sites used for COBRA. The solid and dashed lines indicate sequences amplified for COBRA and sequence analysis following bisulfite conversion of DNA. Inner primer positions were indicated by solid arrows.
Figure 2
Figure 2
Methylation analysis of paired tumor and normal kidney samples using COBRA. The degree of methylation in kidney samples was analyzed using COBRA and video densitometry for determination of methylated (M) and unmethylated (U) band signals: L, length marker; C1, negative methylation control (plasmid pCU); C2, positive methylation control (plasmid pCM); CO, negative control; T1 – T3, tumoral and P1 – P3, normal paired tissue samples.
Figure 3
Figure 3
Results of quantitative methylation analysis of tissue pairs. a. Primary data and box plot illustration for in group comparison of relative methylation of RASSF1A promoter as measured by COBRA in 45 tumor and paired normal renal tissue samples as well as plasmid – DNA negative controls. Note that 44 (98%) tumors and 44 (98%) of 45 paired normal tissues demonstrated relative methylation greater than 2.75% determined as limit of analytical sensitivity. b. Quantitative methylation analysis of the RASSF1A promoter in 45 tumoral and normal tissue pairs using combined bisulfite restriction analysis (COBRA). Note that most of the tumors demonstrate a substantial relative increase in methylation when compared to their corresponding normal tissue (P < 0.001)
Figure 4
Figure 4
Bisulfite sequence analysis of RASSF1A promoter methylation in one tissue pair of tumoral and normal tissue. RASSF1A promoter amplicons obtained from a single tumoral (T) and its paired normal (P) tissue sample were subcloned and each 50 clones analyzed by the use of bisulfite sequencing. For each clone the methylation status of analyzed CpG sites is shown (solid circles: methylation, open circles: no methylation). Numbers on x-axis refer to base pair positions as indicated in Figure 1. Asterisks indicate amplicons derived from densely methylated promoters demonstrating at least 11 methylated CpG sites.
Figure 5
Figure 5
Bisulfite sequencing of pooled tumoral and normal RASSF1A promoters. RASSF1A promoter amplicons from 42 tumoral and 42 normal tissue samples were normalized, pooled, subcloned and each 40 subclones of the tumor (T) and normal (P) group analyzed by bisulfite sequencing. For each clone the methylation status of analyzed CpG sites is shown (solid circles: methylation, open circles: no methylation). Numbers on x-axis refer to base pair positions as indicated in Figure 1. Asterisks indicate amplicons derived from densely methylated promoters demonstrating at least 11 methylated CpG sites.
Figure 6
Figure 6
Detection of RASSF1A protein in clear cell RCC and control cell lines. Paraffin-embedded tissue samples obtained from renal tumor and paired normal tissues were analyzed for presence of RASSF1A protein using immunohistochemistry (counterstaining hematoxylin). a. Immunohistochemical positive control: CaSki cell line demonstrating absence of RASSF1A promoter methylation in COBRA (see box; U, unmethylated signals; M, methylation signals) and immunopositivity depending on the absence (i) or presence (ii) of an antibody blocking peptide, respectively. b. Immunohistochemical negative control: HEK293 cell line showing strong methylation in COBRA (see box; U, unmethylated signals; M, methylation signals). Only residual unspecific nuclear immunopositivity can be observed, which is independent from the absence (i) and presence (ii) of an antibody blocking peptide. c. Tumor cells of a clear cell RCC (magnification, 400×). d. Histopathologically normal tissue with immunopositive epithelial tubular cells (magnification, 400×). e. Heterogeneous staining patterns demonstrating immunopositive (i) and -negative (ii) epithelia in renal tubules. f. Mosaic-like staining signals in a single tubular epithelium (see arrows, magnified from panel d as indicated).

Similar articles

Cited by

References

    1. Landis SH, Murray T, Bolden S, Wingo PA. Cancer statistics, 1999. CA Cancer J Clin. 1999;49:8–31, 1. - PubMed
    1. Jemal A, Murray T, Ward E, Samuels A, Tiwari RC, Ghafoor A, Feuer EJ, Thun MJ. Cancer statistics, 2005. CA Cancer J Clin. 2005;55:10–30. - PubMed
    1. Thoenes W, Storkel S, Rumpelt HJ. Histopathology and classification of renal cell tumors (adenomas, oncocytomas and carcinomas). The basic cytological and histopathological elements and their use for diagnostics. Pathol Res Pract. 1986;181:125–143. - PubMed
    1. Zbar B, Brauch H, Talmadge C, Linehan M. Loss of alleles of loci on the short arm of chromosome 3 in renal cell carcinoma. Nature. 1987;327:721–724. doi: 10.1038/327721a0. - DOI - PubMed
    1. Gnarra JR, Tory K, Weng Y, Schmidt L, Wei MH, Li H, Latif F, Liu S, Chen F, Duh FM, et al. Mutations of the VHL tumour suppressor gene in renal carcinoma. Nat Genet. 1994;7:85–90. doi: 10.1038/ng0594-85. - DOI - PubMed

MeSH terms