. 2007;8(7):R141.
doi: 10.1186/gb-2007-8-7-r141.

Bias in phylogenetic tree reconciliation methods: implications for vertebrate genome evolution

Affiliations

Bias in phylogenetic tree reconciliation methods: implications for vertebrate genome evolution

Matthew W Hahn. Genome Biol. 2007.

Abstract

Background: Comparative genomic studies are revealing frequent gains and losses of whole genes via duplication and pseudogenization. One commonly used method for inferring the number and timing of gene gains and losses reconciles the gene tree for each gene family with the species tree of the taxa considered. Recent studies using this approach have found a large number of ancient duplications and recent losses among vertebrate genomes.

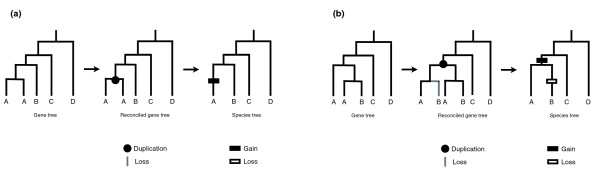
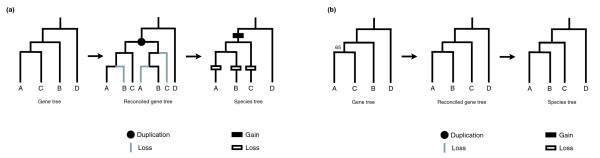
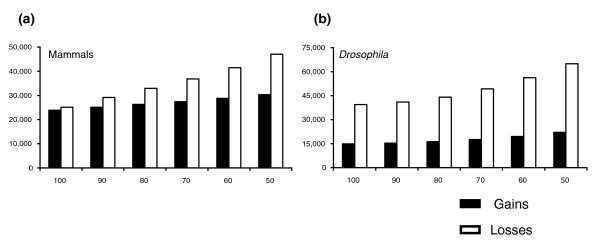
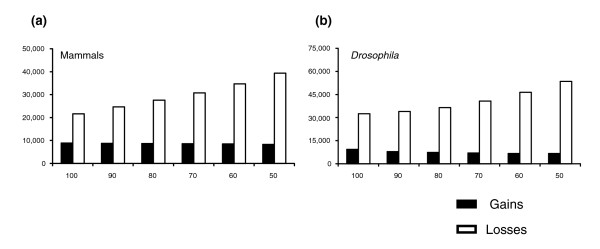
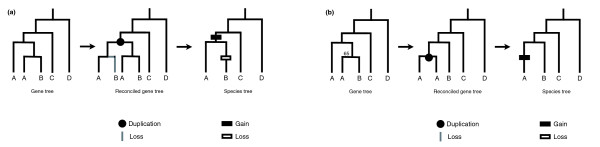
Results: I show that tree reconciliation methods are biased when the inferred gene tree is not correct. This bias places duplicates towards the root of the tree and losses towards the tips of the tree. I demonstrate that this bias is present when tree reconciliation is conducted on both multiple mammal and Drosophila genomes, and that lower bootstrap cut-off values on gene trees lead to more extreme bias. I also suggest a method for dealing with reconciliation bias, although this method only corrects for the number of gene gains on some branches of the species tree.

Conclusion: Based on the results presented, it is likely that most tree reconciliation analyses show biases, unless the gene trees used are exceptionally well-resolved and well-supported. These results cast doubt upon previous conclusions that vertebrate genome history has been marked by many ancient duplications and many recent gene losses.


Figures

Figure 1
Figure 1
Two examples of tree reconciliation. In both (a) and (b) the leftmost tree represents the gene tree, the middle tree the reconciled gene tree showing the duplications and losses, and the rightmost tree shows the species tree with gains (duplications) and losses mapped onto the appropriate branches. The reconciled gene trees represent what the gene tree would look like including lost genes (grey branches).
Figure 2
Figure 2
Tree reconciliation bias. (a) The effect of wrongly inferring the gene tree: the addition of one duplication and three losses. (b) An example where a low bootstrap value (65%) below the cut-off results in the collapse of the gene tree. As a result, no duplications or losses are inferred.
Figure 3
Figure 3
Mammalian species tree. A phylogenetic tree of the six species considered in the text is shown (branches are not proportional to time). Non-informative branches are marked with an arrow.
Figure 4
Figure 4
The effect of tree reconciliation bias. The graphs show the relationship between the number of gains and losses inferred as a function of the bootstrap cut-off used for (a) the mammalian tree, and (b) the Drosophila tree. The numbers represent the sum of gains and losses across all branches of the species trees.
Figure 5
Figure 5
Accounting for tree reconciliation bias. The graphs show the relationship between the number of gains and losses inferred as a function of the bootstrap cut-off used for (a) the mammalian tree, and (b) the Drosophila tree. The numbers represent the sum of gains and losses across only informative branches of the species trees.
Figure 6
Figure 6
Slight bias towards placing duplicates on the tips of the tree. (a) Shows how gains and losses would be inferred for the gene tree shown. (b) Taking into account bootstrap support can result in placing duplicates towards the tips as gene tree topologies are collapsed.
Figure 7
Figure 7
Relationship between tree reconciliation and likelihood methods for estimating the number of gene gains. The number of gene duplicates inferred on only informative branches of the (a) mammalian tree, and (b) Drosophila tree are shown.

Similar articles

Cited by

References

    1. Aravind L, Watanabe H, Lipman DJ, Koonin EV. Lineage-specific loss and divergence of functionally linked genes in eukaryotes. Proc Natl Acad Sci USA. 2000;97:11319–11324. - PMC - PubMed
    1. McLysaght A, Baldi PF, Gaut BS. Extensive gene gain associated with adaptive evolution of poxviruses. Proc Natl Acad Sci USA. 2003;100:15655–15660. - PMC - PubMed
    1. Hahn MW, De Bie T, Stajich JE, Nguyen C, Cristianini N. Estimating the tempo and mode of gene family evolution from comparative genomic data. Genome Res. 2005;15:1153–1160. - PMC - PubMed
    1. Demuth JP, De Bie T, Stajich JE, Cristianini N, Hahn MW. The evolution of mammalian gene families. PLoS ONE. 2006;1:e85. - PMC - PubMed
    1. Bridges CB. The Bar "gene" a duplication. Science. 1936;83:210–211. - PubMed

Publication types

LinkOut - more resources