. 2007 Oct;81(19):10699-711.
doi: 10.1128/JVI.01213-07. Epub 2007 Jul 18.

Herpes simplex virus type 1 C-terminal variants of the origin binding protein (OBP), OBPC-1 and OBPC-2, cooperatively regulate viral DNA levels in vitro, and OBPC-2 affects mortality in mice

Affiliations

Herpes simplex virus type 1 C-terminal variants of the origin binding protein (OBP), OBPC-1 and OBPC-2, cooperatively regulate viral DNA levels in vitro, and OBPC-2 affects mortality in mice

Malen A Link et al. J Virol. 2007 Oct.

Abstract

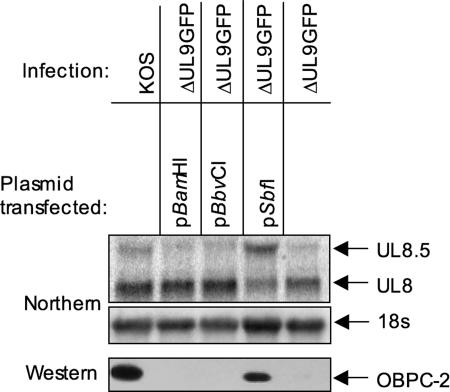
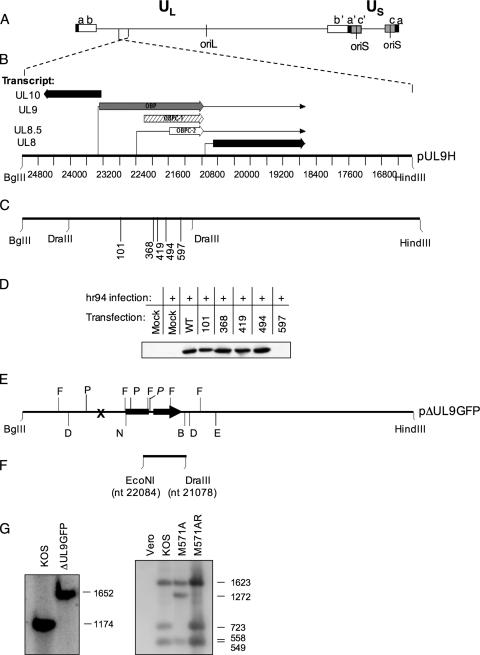
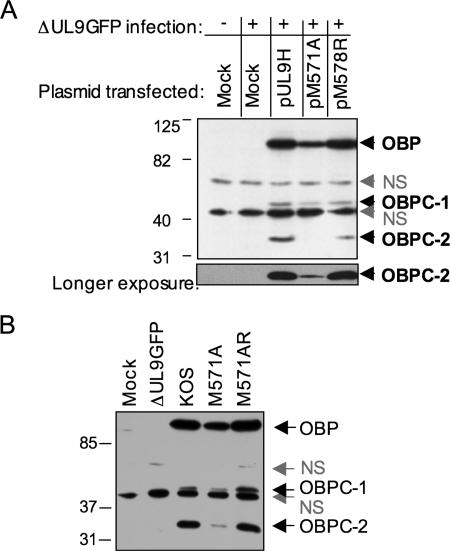
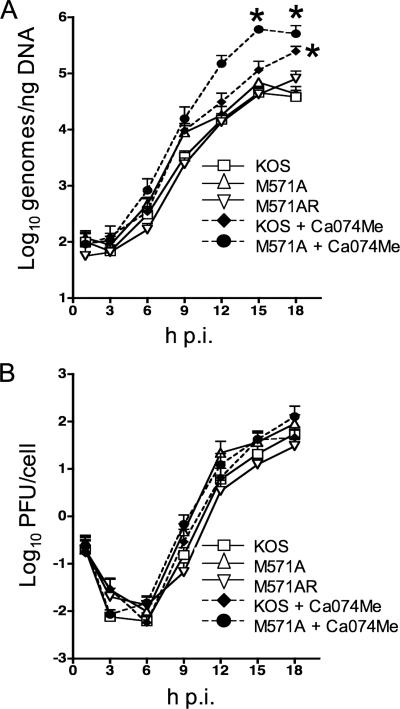
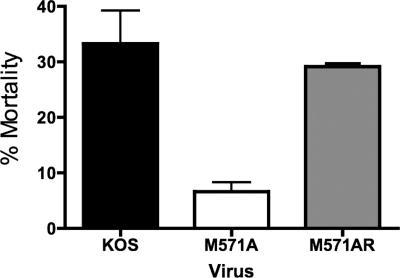
Two in-frame, C-terminal isoforms of the herpes simplex virus type 1 (HSV-1) origin binding protein (OBP), OBPC-1 and OBPC-2, and a unique C-terminal transcript, UL8.5, are specified by HSV-1 DNA. As the first isoform identified, OBPC-1 was initially assumed to be the product of the UL8.5 transcript. Recent evidence has demonstrated, however, that OBPC-1 is a cathepsin B-mediated cleavage product of OBP, suggesting that OBPC-2 is the product of the UL8.5 transcript. Because both OBPC-1 and -2 contain the majority of the OBP DNA binding domain, we hypothesized that both may be involved in regulating origin-dependent, OBP-mediated viral DNA replication. In this paper, we demonstrate that OBPC-2 is, indeed, the product of the UL8.5 transcript. The translational start site of OBPC-2 was mapped, and a virus (M571A) that does not express this protein efficiently was constructed. Using M571A, we have shown that OBPC-2 is able to bind origin DNA, even though it lacks seven N-terminal amino acid residues of the previously mapped OBP DNA binding domain, resulting in a revision of the limits of the OBP DNA binding domain. Consistent with their proposed roles in regulating viral DNA replication, OBPC-1 and -2 act together to down-regulate viral DNA replication in vitro. During functional studies in vivo, OBPC-2 was identified as a factor that increases mortality in the mouse ocular model of HSV-1 infection.


Figures

FIG. 1.
FIG. 1.
Diagrams of OBP, OBPC-1, OBPC-2, and UL9CT. The DNA binding domains of the four proteins are represented by the hatched regions. Helicase domains are shown in gray and numbered I to VI. The ATPase domain, leucine zipper, and putative PEST sequence of OBP are shown in black. The N-terminal half of OBP confers dimerization ability and contains domains that interact with the proteins encoded by the UL8 (member of the helicase/primase complex) and UL42 (the polymerase accessory factor) genes. The nuclear localization signal (NLS) and ICP8 binding domain are located in the C-terminal half of OBP and are present in all four proteins. Hatched lines at the beginning of OBPC-1 and OBPC-2 indicate that at the inception of these studies, the translational start sites were unknown. The scale beneath the figure represents amino acids.
FIG. 2.
FIG. 2.
OBPC-2 is expressed from the UL8.5 transcript. Results shown are from a Northern blot analysis of total cellular RNA isolated from Vero cells transfected with the indicated plasmid and/or infected with the indicated virus and using the 8R3′ riboprobe (4). The UL8 and UL8.5 transcripts are shown, as is the 18S band. Also shown are Western blot results using anti-OBPCT to detect OBPC-2 in whole-cell extracts of Vero cells transfected with the indicated plasmid and/or infected with the indicated virus.
FIG. 3.
FIG. 3.
Construction of mutant plasmids and viruses. (A) Diagram of the HSV-1 genome showing the UL region flanked by inverted repeat sequences (a b and b′ a′) and the US region flanked by inverted repeat sequences a′ c′ and c a. The locations of oriL and oriS are shown. (B) The 9.5-kb HSV-1 sequences between the BglII and HindIII sites included in the plasmid pUL9H are shown. The directions and locations of the UL8 to -10 transcripts and their directions of transcription are indicated. The scale represents the nucleotides of the HSV-1 genome. (C) The locations of the amino acid codons (101 to 597) into which nonsense mutations were introduced into pUL9H. The DraIII restriction sites (nt 24037 and 21078 in the HSV-1 genome) used to clone the mutant sequences from pADE to pUL9H are indicated. (D) Western blot analysis using anti-OBPCT to detect OBPC-2 in nuclear extracts of Vero cells transfected with plasmids containing the indicated nonsense mutations and infected with hr94 or mock infected. (E) Plasmid pΔUL9FP. The location of the nonsense mutation (X) in pUL9n24 is shown. The cytomegalovirus IE promoter is represented as a black rectangle, and the EGFP-N1 gene is shown as a black arrow. The DraIII restriction sites (D) (nt 24037 to 21078 in the HSV-1 genome) used to generate the ΔUL9GFP virus and construct the probe for Southern blot analysis are indicated. Locations of the FspI (F) and PstI (P) restriction sites used to screen mutant viruses are also shown. The P site in the GFP cassette is denoted in italics. The NcoI (N) and BstBI (B) restriction enzyme sites used to clone the EGFP-N1 cassettes into pUL9H are shown. The DraIII (D)-EcoRV (E) sites that comprise the DNA fragment in pADE are indicated. (F) The location of the ∼1-kb wild-type EcoNI-DraIII fragment (nt 22084 to 21078 of the HSV-1 genome) used to generate the rescuant virus M571AR is shown. (G) Southern blot analysis of wild-type, mutant, and rescuant viruses. Blots were probed with either a radiolabeled DraIII fragment or radiolabeled PstI fragment. Fragment sizes are indicated to the right of the blot.
FIG. 4.
FIG. 4.
Identification of the OBPC-2 translational start site. (A) Western blot analysis to detect OBPC-2 using anti-OBPCT in nuclear extracts of Vero cells transfected with the indicated plasmids and infected with ΔUL9GFP. The locations of OBP, OBPC-1, and OBPC-2 bands as well as nonspecific (NS) bands are indicated. (B) Western blot analysis of nuclear extracts of cells infected with wild-type, mutant, or rescuant viruses.
FIG. 5.
FIG. 5.
OBPC-2 binds site I DNA in viral origins. Gel shift analysis of whole-cell extracts of undifferentiated PC12 cells infected with the indicated viruses or mock infected and incubated with a radiolabeled 24-mer whose sequence spans site I of oriS is shown in the presence or absence of RH7 antibody. Complexes A and C, as defined by Isler and Schaffer (28), are denoted. The presence of a nonspecific (NS) band and the location of the free probe are also indicated.
FIG. 6.
FIG. 6.
OBPC-1 and OBPC-2 are required to achieve wild-type levels of viral DNA synthesis. Vero cells were infected at an MOI of 2.5 PFU/cell with KOS, M571A, or M571AR in the presence or absence of the cathepsin B inhibitor Ca074Me. Cells were harvested at 1 h p.i. and every 3 h p.i. thereafter for 18 h by scraping into medium. (A) Total cell DNA was isolated, and DNA amounts were measured by real-time PCR analysis using a probe specific for the TK promoter. (B) Cells were frozen, thawed, and sonicated. Cell debris was pelleted, and the titer of infectious virus in the supernatant was determined on Vero cells by standard plaque assay. The results of three experiments are shown as the means ± the standard errors. Statistical comparisons were performed using a two-way ANOVA. Asterisks indicate significant differences between KOS with and without drug and M571A with and without drug.
FIG. 7.
FIG. 7.
Viral titers in tear film, TG, and cerebella of mice infected with KOS, M571A, or M571AR. Following corneal scarification, 5- to 6-week-old male CD-1 mice were inoculated in both eyes with 2 × 10⁵ PFU/eye of the indicated virus. (A) Each day for 9 days p.i. (d.p.i.), viral titers in the tear film of eight mice per virus were determined by standard plaque assay on Vero cell monolayers. (B and C) Four mice per virus were euthanized by CO2 asphyxiation, and the TG and cerebella were harvested and processed. Viral titers were determined by standard plaque assay on Vero cell monolayers. The results shown represent the average of three experiments for the tear film titers and two experiments for titers in TG and cerebella. The mean titers ± the standard deviations are graphed. Statistical analysis was performed using a two-way ANOVA.
FIG. 8.
FIG. 8.
Establishment and reactivation of KOS, M571A, and M571AR from latency. (A) Genome loads in TG of latently infected mice. Following corneal scarification, four 5- to 6-week-old male CD-1 mice per virus were infected in both eyes with 2 × 10⁵ PFU/eye of the indicated virus. At 30 days p.i., mice were euthanized by CO2 asphyxiation and TG were removed and processed. Viral DNA was measured by real-time PCR using primers specific for the thymidine kinase gene. The results shown are the averages of three experiments and are presented as the means ± the standard deviations. Statistical comparison was performed using a one-way ANOVA. (B) Reactivation efficiencies of KOS, M571A, and M571AR from TG explants. TG from 6 mice per virus (12 TG per virus) were removed on day 30 p.i. Medium (150 μl) from each cultured TG was removed daily for 9 days postexplant (d.p.e.) to detect reactivated virus. Specifically, medium samples were transferred to indicator plates of Vero cells, which were monitored daily for cytopathic effects. The results shown are the averages of two or three experiments ± the standard deviations. A statistical comparison was performed using a two-way ANOVA.
FIG. 9.
FIG. 9.
Mortality rates of mice infected with KOS, M571A, or M571AR. Mortality rates were tabulated during latency experiments. Specifically, the number of mice that died during each experiment was counted. The results represent the average of two experiments, with 24 mice per virus per experiment. The results are shown are the means ± the standard deviations. Statistical significance of the differences was determined by a one-way ANOVA and Bonferroni's multiple comparisons test.

Similar articles

Cited by

References

    1. Arbuckle, M. I., and N. D. Stow. 1993. A mutational analysis of the DNA-binding domain of the herpes simplex virus type 1 UL9 protein. J. Gen. Virol. 74:1349-1355. - PubMed
    1. Balliet, J. W., J. C. Min, M. S. Cabatingan, and P. A. Schaffer. 2005. Site-directed mutagenesis of large DNA palindromes: construction and in vitro characterization of herpes simplex virus type 1 mutants containing point mutations that eliminate the oriL or oriS initiation function. J. Virol. 79:12783-12797. - PMC - PubMed
    1. Balliet, J. W., and P. A. Schaffer. 2006. Point mutations in herpes simplex virus type 1 oriL, but not in oriS, reduce pathogenesis during acute infection of mice and impair reactivation from latency. J. Virol. 80:440-450. - PMC - PubMed
    1. Baradaran, K., C. E. Dabrowski, and P. A. Schaffer. 1994. Transcriptional analysis of the region of the herpes simplex virus type 1 genome containing the UL8, UL9, and UL10 genes and identification of a novel delayed-early gene product, OBPC. J. Virol. 68:4251-4261. - PMC - PubMed
    1. Baradaran, K., M. A. Hardwicke, C. E. Dabrowski, and P. A. Schaffer. 1996. Properties of the novel herpes simplex virus type 1 origin binding protein, OBPC. J. Virol. 70:5673-5679. - PMC - PubMed

Publication types