. 2007 Oct;18(10):3752-63.
doi: 10.1091/mbc.e07-03-0281. Epub 2007 Jul 18.

Inactivation of Rho GTPases with Clostridium difficile toxin B impairs centrosomal activation of Aurora-A in G2/M transition of HeLa cells

Affiliations

Inactivation of Rho GTPases with Clostridium difficile toxin B impairs centrosomal activation of Aurora-A in G2/M transition of HeLa cells

Yoshikazu Ando et al. Mol Biol Cell. 2007 Oct.

Abstract

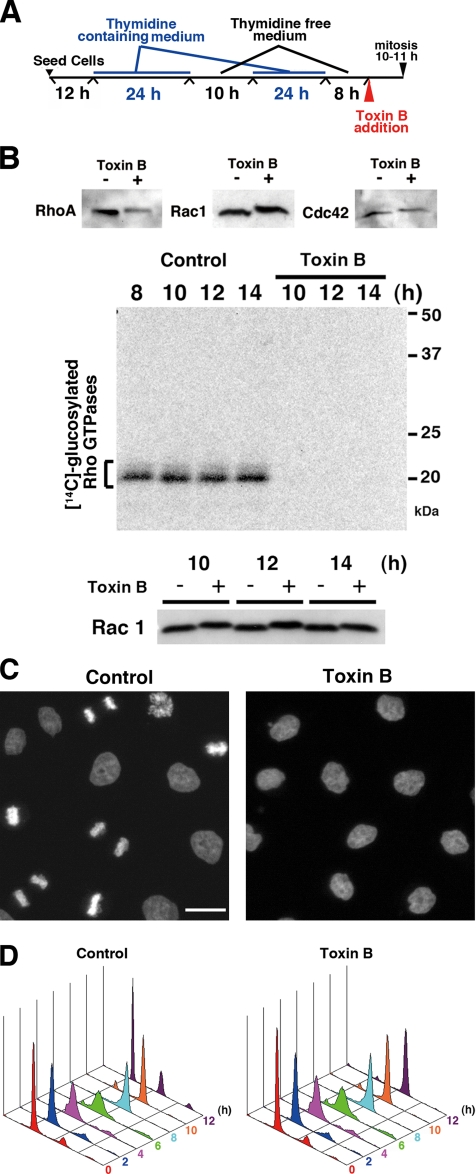
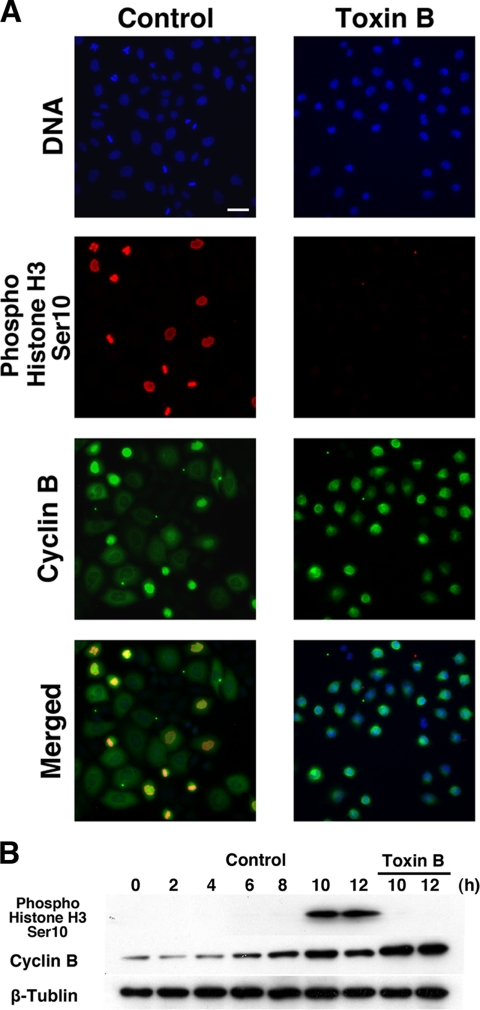
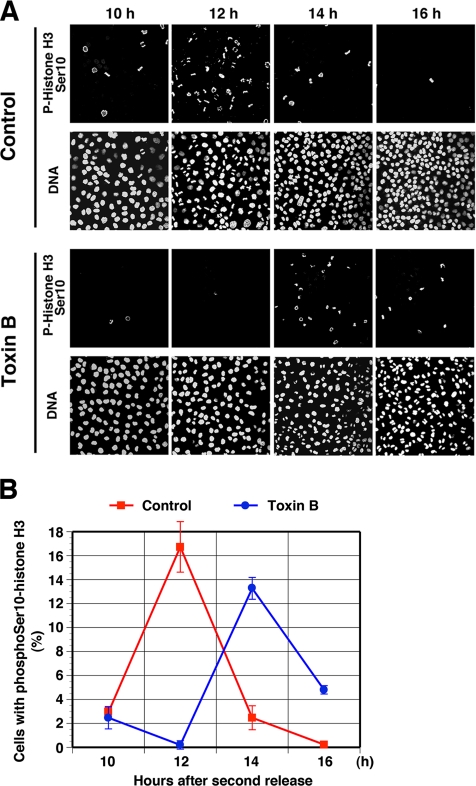
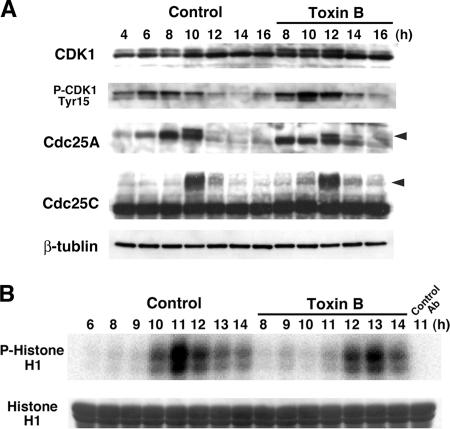
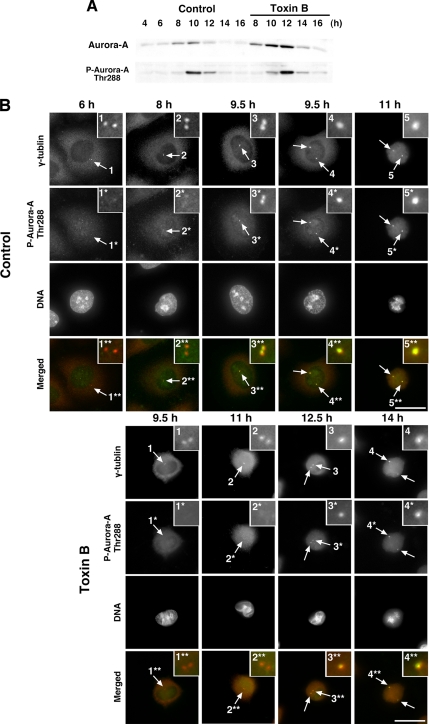
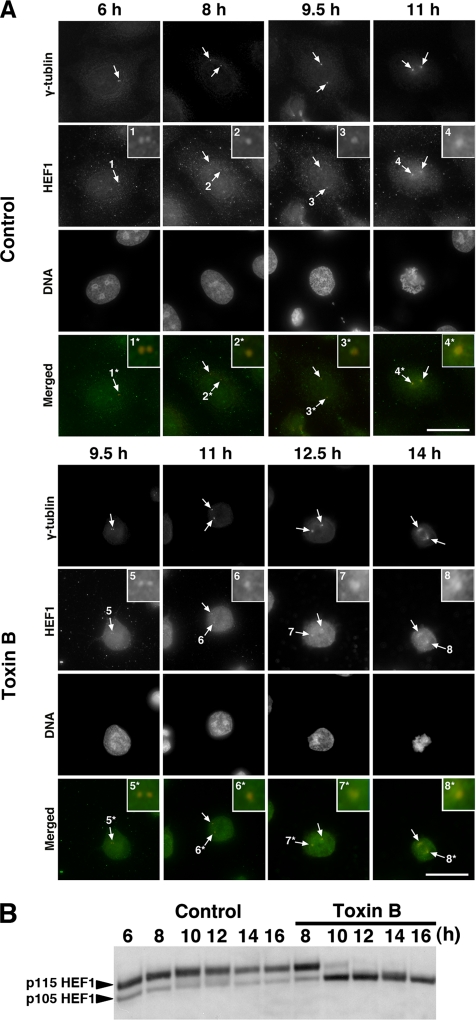
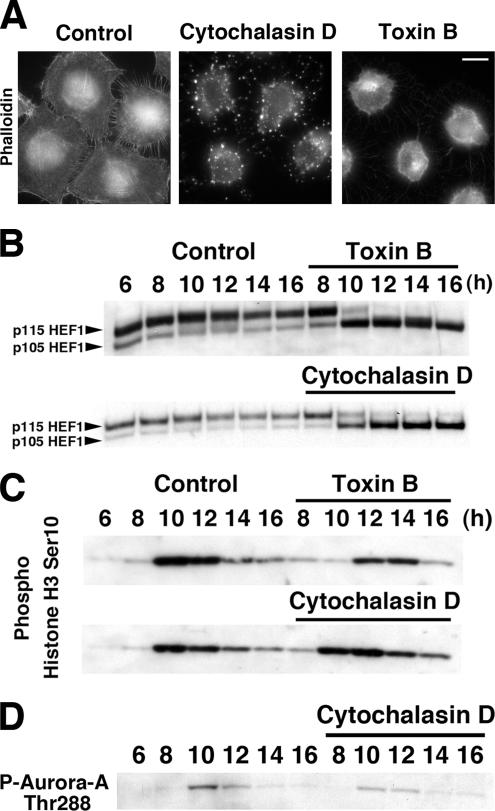
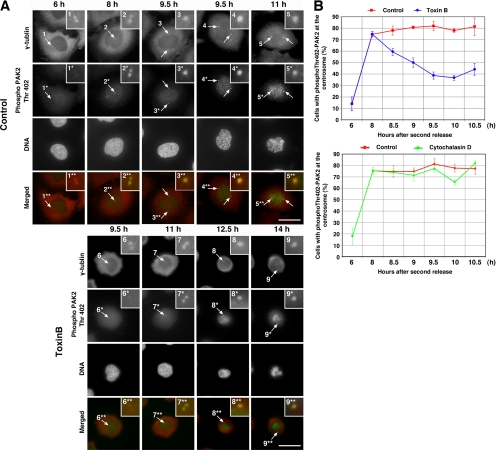
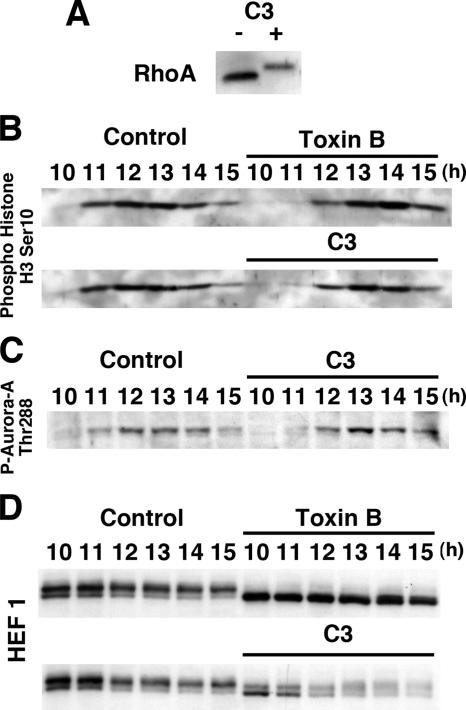
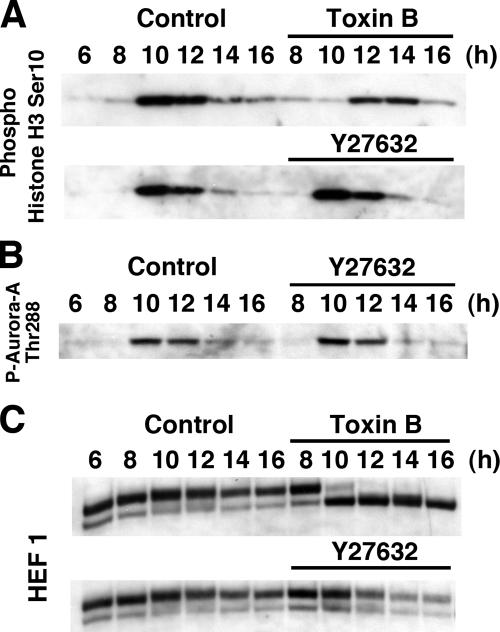
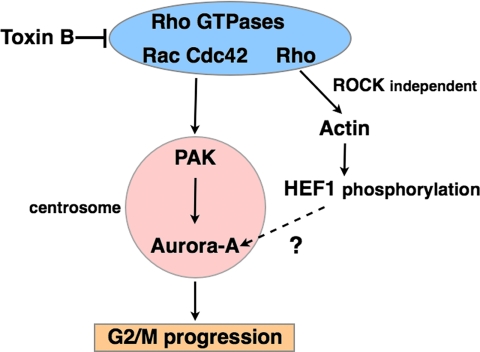
During G2 phase of cell cycle, centrosomes function as a scaffold for activation of mitotic kinases. Aurora-A is first activated at late G2 phase at the centrosome, facilitates centrosome maturation, and induces activation of cyclin B-Cdk1 at the centrosome for mitotic entry. Although several molecules including HEF1 and PAK are implicated in centrosomal activation of Aurora-A, signaling pathways leading to Aurora-A activation at the centrosome, and hence mitotic commitment in vertebrate cells remains largely unknown. Here, we have used Clostridium difficile toxin B and examined the role of Rho GTPases in G2/M transition of HeLa cells. Inactivation of Rho GTPases by the toxin B treatment delayed by 2 h histone H3 phosphorylation, Cdk1/cyclin B activation, and Aurora-A activation. Furthermore, PAK activation at the centrosome that was already present before the toxin addition was significantly attenuated for 2 h by the addition of toxin B, and HEF1 accumulation at the centrosome that occurred in late G2 phase was also delayed. These results suggest that Rho GTPases function in G2/M transition of mammalian cells by mediating multiple signaling pathways converging to centrosomal activation of Aurora-A.


Figures

Figure 1.
Figure 1.
Inhibition of G2/M progression by toxin B treatment. (A) Experimental protocol. (B) Modification of Rho GTPases by toxin B treatment. Top, HeLa cells were collected 10 h after the second thymidine release, i.e., after 2-h treatment with or without toxin B, and subjected to immunoblot analysis for RhoA, Rac, and Cdc42. Middle and bottom, HeLa cells treated with or without toxin B were collected at indicated times after the release and subjected to the in vitro glucosylation assay (middle) and immunoblot analysis for Rac1 (bottom). Note that no in vitro glucosylation occurred in the toxin B pretreated cells (top), that the toxin B treatment induced mobility shift of Rho GTPases, and that these changes persisted in the period examined. (C) DAPI staining of control and toxin B–treated cells 12 h after the release. Synchronized HeLa cells were stained with DAPI for DNA after treatment with or without 50 ng/ml toxin B for 4 h. Note that control cells showed various mitotic figures, whereas toxin B–treated cells exhibited partially condensed chromosomes. Bar, 10 μm. (D) Flow cytometry for cell cycle progression of control and toxin B–treated cells. HeLa cells were synchronized and treated according to the protocol shown in A, collected at indicated times after the second release and subjected to flow cytometry after staining with propidium iodide.
Figure 2.
Figure 2.
Effects of toxin B treatment on histone H3 Ser10 phosphorylation and cyclin B expression. (A) Immunofluorescence for histone H3 Ser10 phosphorylation and cyclin B in control and toxin B–treated HeLa cells. Toxin B was added to the culture 8 h after the second release, and cells were fixed at 10 h and stained for histone H3 Ser10 phosphorylation (red), cyclin B (green), and DNA (blue). Typical results of three independent experiments are shown. Bar, 10 μm. (B) Immunoblot analysis for histone H3 Ser10 phosphorylation and cyclin B. HeLa cells were collected every 2 h from 0 to 12 h after the second release, and lysates were prepared and subjected to immunoblot with antibodies to phosphoSer10-hisotne H3, cyclin B, and β-tubulin. Note the extensive phosphoSer10-histone H3 band in lysates of control cells at 10 and 12 h, which is absent in the corresponding lysates of toxin B–treated cells.
Figure 3.
Figure 3.
(A) Mitotic entry delay by toxin B treatment. HeLa cells were fixed at indicated times after the second release and stained for phosphoSer10-hisotne H3 and DNA. Note that Ser10-histone H3 phosphorylation appears 14 h after the second release in the toxin B–treated cells with concomitant appearance of mitotic figures. Sustained mitotic figures in the toxin B–treated cell population at 16 h is due to mitotic arrest induced by this toxin (Yasuda et al., 2004). Typical results of three independent experiments are shown. (B) Quantitative analysis. The number of cells positive for phosphoSer10-histone H3 was determined in 300 cells of each population at each time and is presented as %. Data are mean ± SEM (n = 3).
Figure 4.
Figure 4.
Delayed activation of cyclin B/Cdk1 complex in toxin B–treated cells. (A) Immunoblot analysis for Cdk1, phosphoTyr15-Cdk1, Cdc25A, and Cdc25C. HeLa cells were collected every 2 h from 4 to 16 h after the second release with the toxin B addition at 8 h. Total cell lysates were prepared and subjected to SDS-PAGE and immunoblot analysis as indicated. Arrowheads indicate a phosphorylated form of each Cdc25 isoform. (B) Kinase assay of the cyclin B/Cdk1 complex. HeLa cells were collected at indicated times after the second release. Cell lysates were prepared and subjected to immunoprecipitation with antibody to cyclin B1. Immunoprecipitates were incubated with histone H1 in the presence of [γ-32P]ATP, and [32P]phosphorylated histone H1 was analyzed by SDS-PAGE and autoradiography.
Figure 5.
Figure 5.
Aurora-A expression and activation at the centrosome in toxin B–treated cells. (A) Immunoblot analysis for Aurora-A and phosphoThr288-Aurora-A. HeLa cells were collected at indicated times after the second release with addition of toxin B at 8 h. Cell lysates were prepared and subjected to immunoblot as indicated. (B) Immunofluorescence for phosphoThr288-Aurora-A in control and toxin B–treated cells. HeLa cells were fixed at indicated times after the second release and stained for γ-tubulin (red), phosphoThr288-Aurora-A (green), and DNA. Insets show magnified views of the centrosome indicated by numbered arrows. (Note that Aurora-A activation examined as phosphoThr288-Aurora-A appeared 9.5 h after the release in control cells, whereas it became evident 12.5 h in toxin B–treated cells.) Typical results of at least three independent experiments are shown. Bar, 10 μm.
Figure 6.
Figure 6.
Effects of toxin B treatment on localization and Ser/Thr phosphorylation of HEF1. (A) Immunofluorescence for HEF1. HeLa cells were fixed with methanol after pre-extraction with 0.5% Triton X-100 in PHEM buffer and stained for HEF1 (green), γ-tubulin (red), and DNA. Arrows indicate centrosomes, and insets show magnified views of the centrosomes indicated numbered arrows. Note that HEF1 was already present at the centrosome in the end of S phase (6 h) and increased its amount during G2 progression in control cells and that this increase was delayed in toxin B–treated cells. (B) Immunoblot for HEF1. HeLa cells were collected at indicated times after the release with toxin B addition at 8 h and were subjected to immunoblot for HEF1. Note that the toxin B treatment abolished p115 phosphorylated form of HEF1. Typical results of at least three independent experiments are shown. Bar, 10 μm.
Figure 7.
Figure 7.
Effects of cytochalasin D on HEF1 phosphorylation and G2/M transition. (A) Phalloidin staining. HeLa cells were treated with either 50 ng/ml toxin B or 4 μM cytochalasin D from 8 to 10 h after the second release and were then fixed and stained with rhodamine-phalloidin. Note that both toxin B and cytochalasin D disrupted actin cytoskeleton structure but in different manners. Bar, 10 μm. (B) Effects on HEF1 phosphorylation. HeLa cells were collected at indicated times after the second release with addition of cytochalasin D or toxin B at 8 h and subjected to immunoblotting for HEF1. (C) Effects on Ser10-phosphorylation of histone H3. HeLa cells were treated and collected as above and subjected to immunoblotting for phosphoSer10-hisotne H3. (D) Effects on Aurora-A activation. HeLa cells were collected at indicated times after the second release with addition of cytochalasin D at 8 h. Cell lysates were prepared and subjected to immunoblot for phosphoThr288-Aurora-A as indicated.
Figure 8.
Figure 8.
Inhibition of PAK activation at the centrosome by toxin B treatment. (A) Immunofluorescence for phosphoThr402-PAK2. HeLa cells were fixed at indicated times after the second release and stained for γ-tubulin (red), phosphoThr402-PAK2 (green), and DNA. Insets show magnified views of the centrosome indicated by numbered arrows. Note that PAK activation examined as phosphoThr402-PAK2 present 8 h after the release was abolished at 9.5 h in toxin B–treated cells. The phosphoThr402-PAK2 signals on chromosomes of mitotic cells may represent PAK activation at kinetochores (Li et al., 2002). Typical results of at least three independent experiments are shown. Bar, 10 μm. (B) Quantitative analysis on PAK activation. HeLa cells treated with either toxin B (top) or cytochalasin D (bottom) were fixed at indicated times after the second release and stained for γ-tubulin and phosphoThr402-PAK2. The number of cells with a signal of phosphoThr402-PAK2 at the centrosome was determined in 50 cells of each population. Data are mean ± SEM (n = 3).
Figure 9.
Figure 9.
Effects of botulinum C3 exoenzyme on G2/M transition. (A) Modification of Rho GTPases by C3 exoenzyme treatment. Note the slower mobility of bands for the RhoA in the lysates of cells treated with C3 exoenzyme. (B) Effect on Ser10-phosphorylation of histone H3. Either toxin B or C3 exoenzyme or vehicle was electropermeated into HeLa cells 6.5 h after the second release. The cells were then collected at indicated times and subjected to immunoblotting for phosphoSer10-histone H3. (C) Effects on Aurora-A activation. HeLa cells treated as above were collected and subjected to immunoblotting for phosphoThr288-Aurora-A. (D) Effects on HEF1 phosphorylation. HeLa cells treated as above were collected and subjected to immunoblotting for HEF1.
Figure 10.
Figure 10.
Effects of Y27632 on G2/M transition. (A) Effect of Y27632 on Ser10-phosphorylation of histone H3. Y-27632 was added to HeLa cells 8 h after the second release. The cells were collected at indicated times after the second release and subjected to immunoblotting for phosphoSer10-histone H3. (B) Effect of Y27632 on Aurora-A activation. HeLa cells were treated and collected as above and subjected to immunoblotting for phosphoThr288-Aurora-A. (C) Effects on HEF1 phosphorylation. Cell lysates were prepared as above and subjected to immunoblotting for HEF1.
Figure 11.
Figure 11.
A current model for Rho GTPase signaling in G2/M progression.

References

    1. Aktories K., Barbieri J. T. Bacterial cytotoxins: targeting eukaryotic switches. Nat. Rev. Microbiol. 2005;3:397–410. - PubMed
    1. Bayliss R., Sardon T., Vernos I., Conti E. Structural basis of Aurora-A activation by TPX2 at the mitotic spindle. Mol. Cell. 2003;12:851–862. - PubMed
    1. Bakal C. J., Finan D., LaRose J., Wells C. D., Gish G., Kulkarni S., DeSepulveda P., Wilde A., Rottapel R. The Rho GTP exchange factor Lfc promotes spindle assembly in early mitosis. Proc. Natl. Acad. Sci. USA. 2005;102:9529–9534. - PMC - PubMed
    1. Barth H., Klingler M., Aktories K., Kinzel V. Clostridium botulinum C2 toxin delays entry into mitosis and activation of p34cdc2 kinase and cdc25-C phosphatase in HeLa cells. Infect. Immun. 1999;67:5083–5090. - PMC - PubMed
    1. Belmont A. S. Mitotic chromosome structure and condensation. Curr. Opin. Cell Biol. 2006;18:632–638. - PubMed

Publication types

MeSH terms

Substances

LinkOut - more resources