. 2007 Oct;18(10):3764-75.
doi: 10.1091/mbc.e07-03-0275. Epub 2007 Jul 18.

GRP94 is essential for mesoderm induction and muscle development because it regulates insulin-like growth factor secretion

Affiliations

GRP94 is essential for mesoderm induction and muscle development because it regulates insulin-like growth factor secretion

Sherry Wanderling et al. Mol Biol Cell. 2007 Oct.

Abstract

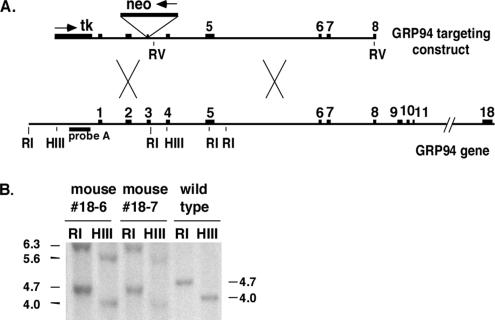
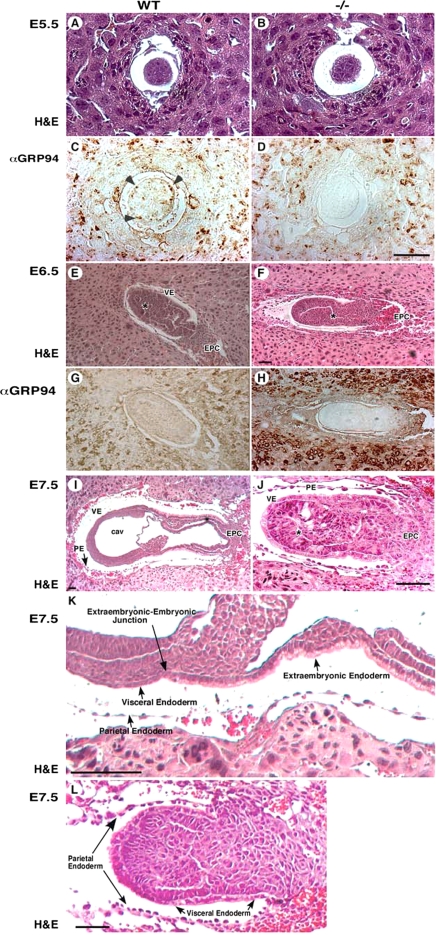
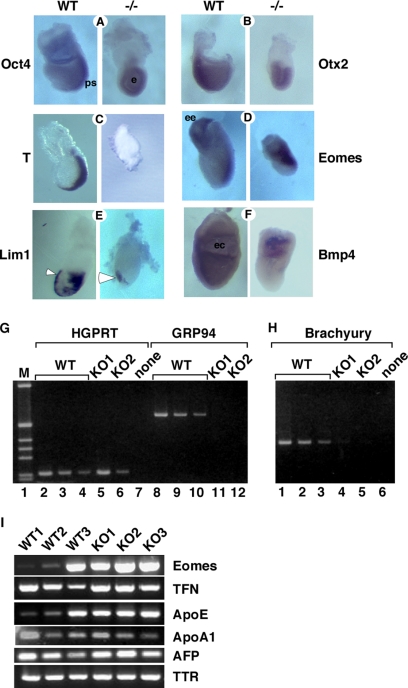
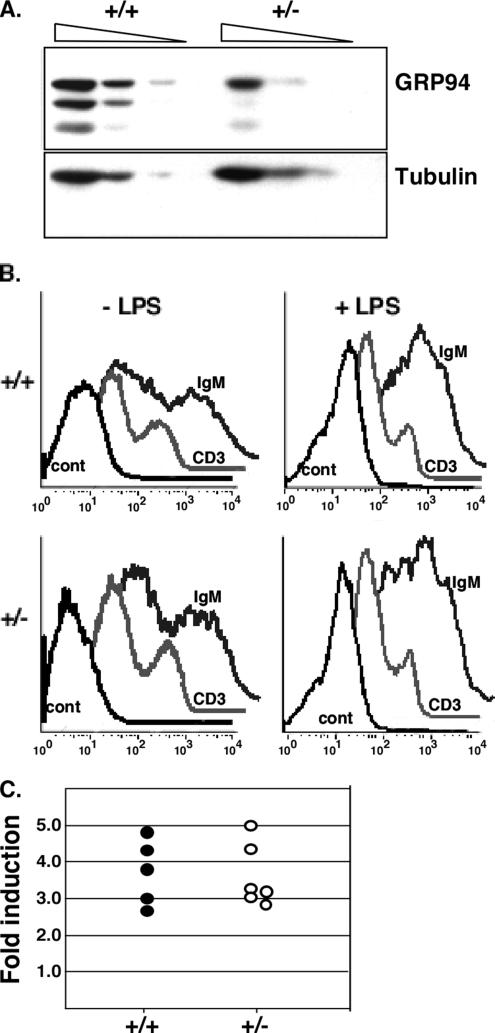
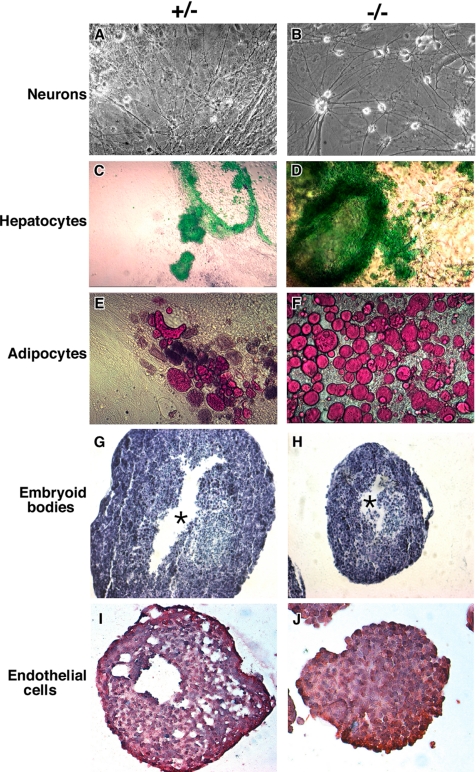
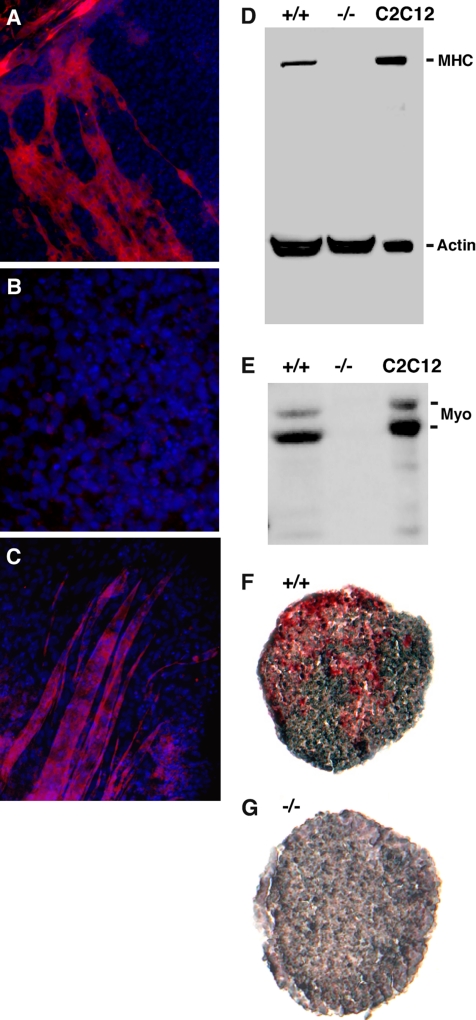
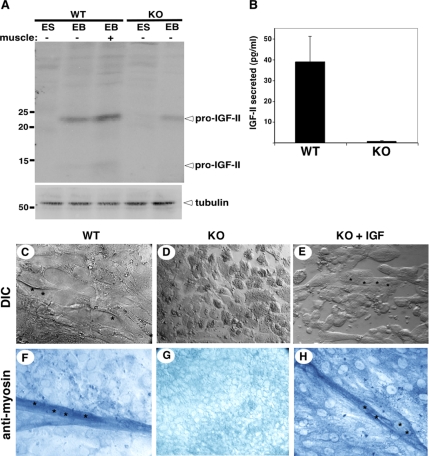
Because only few of its client proteins are known, the physiological roles of the endoplasmic reticulum chaperone glucose-regulated protein 94 (GRP94) are poorly understood. Using targeted disruption of the murine GRP94 gene, we show that it has essential functions in embryonic development. grp94-/- embryos die on day 7 of gestation, fail to develop mesoderm, primitive streak, or proamniotic cavity. grp94-/- ES cells grow in culture and are capable of differentiation into cells representing all three germ layers. However, these cells do not differentiate into cardiac, smooth, or skeletal muscle. Differentiation cultures of mutant ES cells are deficient in secretion of insulin-like growth factor II and their defect can be complemented with exogenous insulin-like growth factors I or II. The data identify insulin-like growth factor II as one developmentally important protein whose production depends on the activity of GRP94.


Figures

Figure 1.
Figure 1.
(A) Targeted disruption of the mouse GRP94 gene. Scheme of the murine gene and the targeting vector. The 18 exons of the GRP94 gene (black boxes) and the introns (thin lines, lengths determined by exon primer PCR and/or sequencing analysis) are drawn to scale, with a gap between exons 11 and 18. The targeting vector contains 1.2-kb 5′ homology generated by PCR amplification and 8.0-kb 3′ homology in an EcoRV fragment. The neo resistance cassette interrupts the coding region at the end of exon 3, 61 amino acids into the mature protein. Its transcriptional orientation is opposite that of the GRP94 gene, as marked by the arrow. The 5′ homology region is flanked by tk, the herpes virus thymidine kinase gene used for negative selection. (B) Correct targeting in two mice was determined by Southern blotting with probe A, located 5′ of the insertion (see arrow in A), after digestion with HindIII (H) or EcoRI (R). A new 6.8-kb EcoRI fragment and a new 6.1-kb HindIII fragment are present in the genome of the correctly targeted mice.
Figure 2.
Figure 2.
Grp94−/− embryos fail to gastrulate. (A–H) Histological and immunostaining analysis of WT (left) and mutant (right) embryos. Transverse sections of E5.5 embryos (A–D), E6.5 embryos (E–H), or E7.5 embryos were stained either with hematoxylin and eosin (H&E, A,B and E,F) or mAb 9G10 (αGRP94, C,D and G,H). This antibody reacts with an epitope in the second, charged domain of GRP94. Arrowheads in C denote individual cells with high GRP94 expression. VE, visceral endoderm; EPC, ectoplacental cone. (E and F) Asterisk denotes the developing proamniotic cavity. (I–L) Histological analysis of E7.5 embryos. Transverse H&E-stained sections showing the lack of mesoderm formation and lack of cavitation in −/− embryos (J; denoted with * compared with WT embryos (I). PA, proamniotic cavity; EC, exoceolomic cavity; PE, parietal endoderm. The arrows in I–L mark the junctions between the embryonic visceral endoderm and the extraembryonic visceral endoderm. (K) Higher magnification image of the embryo in I, showing the cuboidal architecture of cells on the extraembryonic side of the endoderm junction and the squamous morphology of the endoderm cells on the embryonic side of the junction. (L) A similar view of a grp94−/− embryo, where the VE cells on both sides of the junction are cuboidal. Note also the lack of any evidence for proamniotic cavity. The PE cells do not look different in the mutant and WT embryos. All magnification bars, 50 μm.
Figure 3.
Figure 3.
Grp94−/− embryos do not express mesodermal markers. (A–G) Analysis of developmental markers in grp94 mutant embryos by whole mount in situ hybridization. In all pairs, the WT embryo is on the left, and the mutant embryo is on the right. All embryos are E7.5 except where noted. Representative mutant and WT embryos out of 2–7 litters analyzed for each marker are shown. (A) Oct4 is normally expressed throughout the epiblast at E6.5 and is later progressively localized to the primitive streak (ps) at E7.5 in WT embryos. Mutants show sustained overall epiblast (e) expression. (B) Otx2 expression at E7.5 is localized to the anterior region of normal embryos, but is expressed in the entire epiblast of the mutant. (C) Brachyury is expressed in the primitive streak at E7.5 in normal embryos, but is not detectable in E7.5 mutant embryos. (D) Eomes is expressed in WT embryos in the extraembryonic ectoderm (ee) and developing primitive streak. Expression in mutant embryos at E7.5 (shown) resemble WT embryos at E6.5 (not shown). (E) Lim1 is expressed in the AVE (arrowhead) as well as in the primitive streak and node of WT E7.5 embryos, but in mutant embryos, primitive streak expression is absent. (F) Bmp4 expression is detected at E7.5 in the extraembryonic mesoderm lining the exocoelomic cavity (ec) of WT embryos. Mutant embryos express Bmp4 only in the proximal extraembryonic ectoderm. (G–I) Analysis of gene expression by RT-PCR. (G) cDNA was prepared from whole E7.5 embryos carefully dissected away from maternal tissue. One wild-type (WT) and two grp94−/− embryos (KO1 and KO2) are shown. The amount of input cDNA was normalized using HPRT primers in the linear range of the PCR reaction (lanes 1–6). WT cDNA, at 0.25 μl (lanes 2 and 8), 0.125 μl (lanes 3 and 9), and 0.063 μl (lanes 4 and 10) are shown. Lanes 5–6, grp94−/− cDNA, at 11–12: 1.5 μl, from two separate −/− embryos (KO1 and KO2, respectively). The primers for GRP94 amplification span the Neo insertion site and therefore, if there is amplification of KO cDNA, the product is too large to be resolved by the gel. (H) The same cDNAs as in G were used to estimate the expression of brachyury, the canonical early mesoderm marker. Adjusting for the differences of input cDNA, the signal from KO1 is about four times greater than the signal from KO2, but two orders of magnitude weaker than that from WT cDNA. One of four experiments is shown. (I) RT-PCR analysis of expression of mesodermal and VE markers. cDNAs from 3 WT and 3 KO embryos were compared, normalized according to β-tubulin expression. Eomes, the T-box transcription factor eomesodermin. Its expression varies among the three WT embryos likely because WT1–3 were in decreasing age order between E6.5 and E7.5. The VE markers tested were as follows: TFN, transferrin; ApoE, apolipoprotein E; ApoA1, apolipoprotein A1; AFP, α-fetoprotein; TTR, transthyretin.
Figure 4.
Figure 4.
Heterozygous mice are normal. (A) grp94+/− mice have a 50% reduction in GRP94 protein. Liver homogenates were prepared from heterozygous and WT mice, and equal amounts of total protein were loaded in dilution series from left to right (100, 50, and 25 μg) and analyzed by immunoblotting with anti-GRP94 (9G10; top) or with anti-β tubulin (bottom). The three GRP94 bands are the full-length protein and two smaller degradation products (approx. 80 and 70 kDa) that are commonly seen in liver extracts. The blot shown is representative of four replicates. Essentially the same result was also obtained by immunoblots of spleen extracts (not shown). (B) Splenocyte differentiation. Spleen cells from WT (+/+) or heterozygous (+/−) mice were either cultured without treatment or treated with 50 μg/ml LPS to initiate proliferation of B-cells and differentiation into Ig-secreting cells. Three days later, the cultures were stained with anti-IgM antibodies to mark B-cells or with anti-CD3 antibodies to mark T-cells, as internal controls. Control traces, unstained cells. (C) Induction of Ig secretion in splenocytes. Spleen cells from heterozygous or WT mice where treated with 50 μg/ml LPS as above, and 3 d later the levels of Ig in the medium were determined by ELISA with either anti-μ or anti-κ antibodies. The ratio of Ig in the medium before and after LPS treatment was calculated for each spleen culture, normalized for cell number, and is plotted as the magnitude of the induction.
Figure 5.
Figure 5.
Differentiation potential of grp94−/− ES cells. grp94 heterozygous (+/−) ES cells (A, C, and E) and grp94-deficient (−/−) ES cells (B, D, and F) were aggregated into embryoid bodies and induced to differentiate. (A and B) Differentiation into neurons (ectodermal lineage) in the presence of retinoic acid. Note the neuronal-like cells in both cultures. (C and D) Differentiation for 5 d without additives. Cultures were stained with indocyanine green to mark hepatocytes (endodermal lineage). (E and F) Differentiation into adipocytes (mesodermal lineage) in the presence of retinoic acid. Note the red cells that have taken up Oil red O, a characteristic of adipocytes. (G and H) Cavity formation in EBs. EBs were cultured in hanging drops for 9 d, fixed, sectioned, and stained with toluidine blue. Asterisks, the central cavity that forms in both the +/− and −/− EBs. Both panels were photographed at the same magnification. (I and J) Differentiation of endothelial cells. EBs were cultured in hanging drops for 9 d with 0.8% DMSO, fixed, sectioned, and stained with monoclonal anti-Tie-2 (red cells), and counterstained with hemotoxylin (blue-purple).
Figure 6.
Figure 6.
Mutant ES cells fail to differentiate into skeletal muscle. (A) Immunofluorescence of a culture of WT ES cells induced to differentiate into muscle. Cells were fixed and stained with anti-myosin heavy chain antibody MF20 and counterstained with DAPI to highlight nuclei. Note the characteristically shaped myotubes that are positive for myosin heavy chain. (B) A similar immunofluorescence staining of a differentiation culture of mutant ES cells. (C) A subclone of the mutant ES cells (14.1.13) that express GRP94 at levels comparable to WT levels was tested in the differentiation cultures described above. After 19–25 d the cells were stained with anti-myosin as in A. Shown is a field of clone 13 cells. Similar results were obtained with clone 14.1.2. (D) Immunoblot analysis for expression of myosin heavy chain (MHC) in lysates of wild type (+/+) and mutant (−/−) embryoid bodies and in a lysate of C2C12 cells (American Type Culture Collection, Manassas, VA) that were induced to differentiate by serum withdrawal for 48 h. The anti-actin used as a loading control recognizes nonmuscle actin as well as muscle actin. (E) The same membrane shown in C was reprobed for expression of the transcription factor myogenin. (F and G) Cultured EBs were fixed after 9 d and sectioned. Immunohistochemistry was performed with AP-labeled monoclonal anti-smooth muscle actin antibody (red), and sections were counterstained with hematoxylin (purple). WT EBs (F) were positive for smooth muscle actin, but KO EBs (G) were negative.
Figure 7.
Figure 7.
IGF defect and its complementation. (A) Immunoblots of IGF-II in wild-type (WT) and mutant (KO) embryoid bodies. Embryoid bodies (EB) from each genotype were cultured for up to 25 d under conditions promoting muscle differentiation. Single EBs that either displayed contractile behavior (+ muscle) or did not contract (− muscle) were lysed, and their proteins were resolved by SDS-PAGE and probed with anti-IGF-II. The band at 22 kDa is the unprocessed prohormone, and the band at 14 kDa is the result of the first of two proteolytic cleavages (Duguay, 1998). Bottom panel, immunoblot with anti-tubulin, used a loading control. (B) ELISA of IGF-II secreted by WT and KO embryoid bodies. The average ± SD of IGF-II secreted by individual embryoid bodies per milliliter of culture in a 24-h period is plotted for each geneotype. n = 3. (C–E) Myoblast fusion in cultured EBs. ES cells of either WT or KO genotype were cultured under conditions that give rise to extensive myoblast fusion in WT cells (C). Asterisks highlight individual nuclei under DIC optics. (D) KO ES cells under the same conditions remain as individual, separate cells. (E) KO ES cells supplemented with recombinant IGF-I display multiple cyncitia, each with 2–4 nuclei, as indicated by asterisks. Similar results were obtained by adding exogenous IGF-II. All cultures were photographed at the same magnification. (F–H) Myosin expression in cultured EBs. Cultures as in C–E were stained with anti-myosin heavy chain, followed by AP-conjugated secondary antibody.

References

    1. Anderson K. V., Bokla L., Nusslein-Volhard C. Establishment of dorsal-ventral polarity in the Drosophila embryo: the induction of polarity by the Toll gene product. Cell. 1985;42:791–798. - PubMed
    1. Bain G., Kitchens D., Yao M., Huettner J. E., Gottlieb D. I. Embryonic stem cells express neuronal properties in vitro. Dev. Biol. 1995;168:342–357. - PubMed
    1. Baker J., Liu J. P., Robertson E. J., Efstratiadis A. Role of insulin-like growth factors in embryonic and postnatal growth. Cell. 1993;75:73–82. - PubMed
    1. Barnes J. A., Smoak I. W. Immunolocalization and heart levels of GRP94 in the mouse during post-implantation development. Anat. Embryol. 1997;196:335–341. - PubMed
    1. Barnes J. D., Crosby J. L., Jones C. M., Wright C. V., Hogan B. L. Embryonic expression of Lim-1, the mouse homolog of Xenopus Xlim-1, suggests a role in lateral mesoderm differentiation and neurogenesis. Dev. Biol. 1994;161:168–178. - PubMed

Publication types

MeSH terms

LinkOut - more resources