

doi: 10.1093/gerona/62.7.728.
Frailty thy name is ... Phrailty?
Affiliations
- PMID: 17634319
- PMCID: PMC2648133
- DOI: 10.1093/gerona/62.7.728
Item in Clipboard
Frailty thy name is ... Phrailty?
J Gerontol A Biol Sci Med Sci.
2007 Jul.
No abstract available
Figures

Hypothetical Venn diagram depicting incomplete overlap between individuals identified by the Cardiovascular Health Study (CHS) Frailty Index versus the conventional clinical notion of frailty.
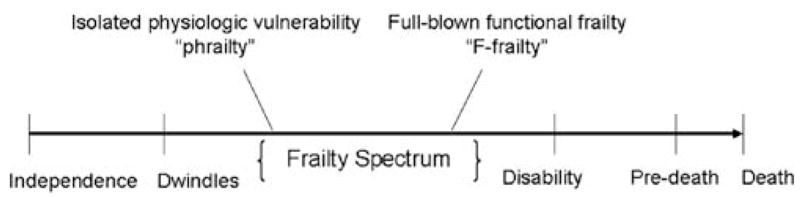
The frailty spectrum within the geriatric functional continuum, based on the Hamerman model. Hamerman’s geriatric functional continuum depicts frailty as one of several midpoints between independence and pre-death (14). In this adaptation, frailty is envisioned as a spectrum of conditions rather than a single entity. The spectrum of frailty includes physiologic vulnerability (phrailty) and full-blown functional frailty (F-frailty) and acknowledges that various understandings of frailty exist within the geriatrics literature and among the lay public. Rather than assuming a consensus definition for frailty, this model allows for multiple frailty phenotypes to be more explicitly defined within the spectrum.
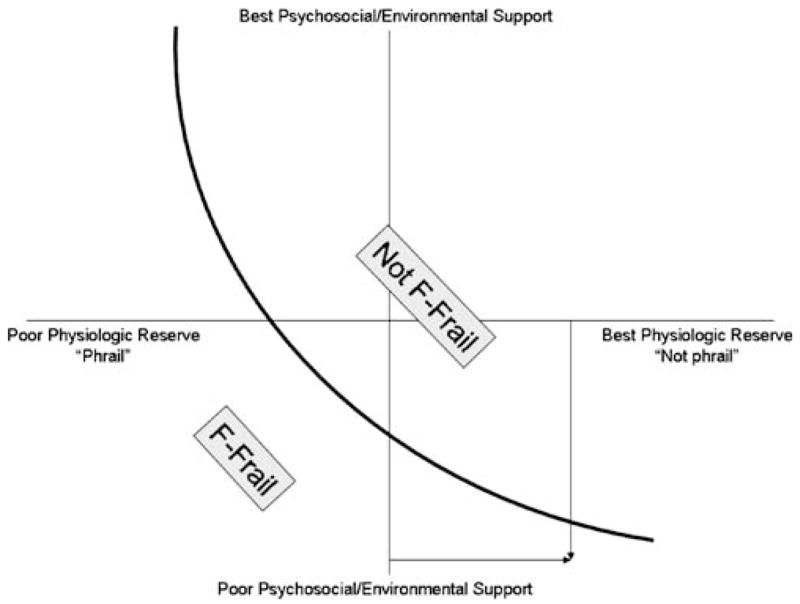
Theoretical relationship between physiologic reserve and psychosocial and/or environmental reserve determining F-frailty status. Any patient with a specific level of physiologic reserve (x axis) and a specific level of psychosocial/environmental support (y axis) can be plotted to a location on this two-dimensional graph. Curve represents a hypothetical F-frailty line, with patients who graph to the left of the curve being defined as F-frail. A patient with fairly good physiologic reserve (who would not exhibit the frailty phenotype, as measured by some indices) might cross this functional frailty threshold if psychosocial support and environmental resources were severely lacking.
Similar articles
-
Reducing Frailty to Promote Healthy Aging.Clin Geriatr Med. 2020 Nov;36(4):613-630. doi: 10.1016/j.cger.2020.06.005. Epub 2020 Sep 1. Clin Geriatr Med. 2020. PMID: 33010898 Review.
-
Validation of the FRAIL scale in Mexican elderly: results from the Mexican Health and Aging Study.Aging Clin Exp Res. 2016 Oct;28(5):901-8. doi: 10.1007/s40520-015-0497-y. Epub 2015 Dec 8. Aging Clin Exp Res. 2016. PMID: 26646253 Free PMC article.
-
[Frailty and ageing, concept and definitions].Rev Infirm. 2017 Dec;66(236):18-20. doi: 10.1016/j.revinf.2017.10.002. Rev Infirm. 2017. PMID: 29179839 French.
-
Age-Related Frailty: A Clinical Model for Geroscience?J Nutr Health Aging. 2020;24(10):1140-1143. doi: 10.1007/s12603-020-1491-4. J Nutr Health Aging. 2020. PMID: 33244574
-
Conceptualisation and measurement of frailty in elderly people.Drugs Aging. 2000 Oct;17(4):295-302. doi: 10.2165/00002512-200017040-00005. Drugs Aging. 2000. PMID: 11087007 Review.
Cited by
-
Physical Activity across Frailty Phenotypes in Females with Parkinson's Disease.J Aging Res. 2012;2012:468156. doi: 10.1155/2012/468156. Epub 2012 Aug 7. J Aging Res. 2012. PMID: 22919489 Free PMC article.
-
A frailty-related phenotype before HAART initiation as an independent risk factor for AIDS or death after HAART among HIV-infected men.J Gerontol A Biol Sci Med Sci. 2011 Sep;66(9):1030-8. doi: 10.1093/gerona/glr097. Epub 2011 Jun 30. J Gerontol A Biol Sci Med Sci. 2011. PMID: 21719610 Free PMC article.
-
Plasmatic Hippuric Acid as a Hallmark of Frailty in an Italian Cohort: The Mediation Effect of Fruit-Vegetable Intake.J Gerontol A Biol Sci Med Sci. 2021 Nov 15;76(12):2081-2089. doi: 10.1093/gerona/glab244. J Gerontol A Biol Sci Med Sci. 2021. PMID: 34436596 Free PMC article.
-
Using the FRAIL scale to compare pre-existing demographic lifestyle and medical risk factors between non-frail, pre-frail and frail older adults accessing primary health care: a cross-sectional study.PeerJ. 2020 Nov 12;8:e10380. doi: 10.7717/peerj.10380. eCollection 2020. PeerJ. 2020. PMID: 33240674 Free PMC article.
-
New light on an age-old issue.Mech Ageing Dev. 2008 Nov;129(11):673-4. doi: 10.1016/j.mad.2008.09.006. Epub 2008 Sep 25. Mech Ageing Dev. 2008. PMID: 18926846 Free PMC article.
References
-
- Walston J, Hadley EC, Ferrucci L, et al. Research agenda for frailty in older adults: toward a better understanding of physiology and etiology: summary from the American Geriatrics Society/National Institute on Aging research conference on frailty in older adults. J Am Geriatr Soc. 2006;54:991–1001. - PubMed
-
- Michelon E, Blaum C, Semba RD, Xue QL, Ricks MO, Fried LP. Vitamin and carotenoid status in older women: associations with the frailty syndrome. J Gerontol Biol Sci Med Sci. 2006;61A:600–607. - PubMed
-
- Fried LP, Tangen CM, Walston J, et al. Frailty in older adults: evidence for a phenotype. J Gerontol Med Sci. 2001;56A:M146–M156. - PubMed
-
- Bandeen-Roche K, Xue OL, Ferrucci L, et al. Phenotype of frailty: characterization in the Women’s Health and Aging Studies. J Gerontol Biol Sci Med Sci. 2006;61A:262–266. - PubMed
Publication types
MeSH terms
Grants and funding
LinkOut - more resources
Full Text Sources
Medical
