. 2007 Sep;98(3):1440-50.
doi: 10.1152/jn.00309.2007. Epub 2007 Jul 18.

Serotonin concentrations in the lumbosacral spinal cord of the adult rat following microinjection or dorsal surface application

Affiliations

Serotonin concentrations in the lumbosacral spinal cord of the adult rat following microinjection or dorsal surface application

Michele R Brumley et al. J Neurophysiol. 2007 Sep.

Abstract

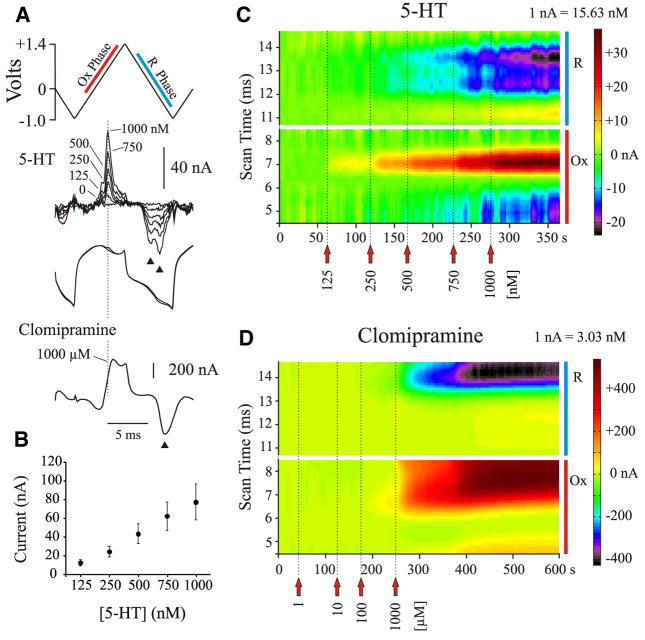
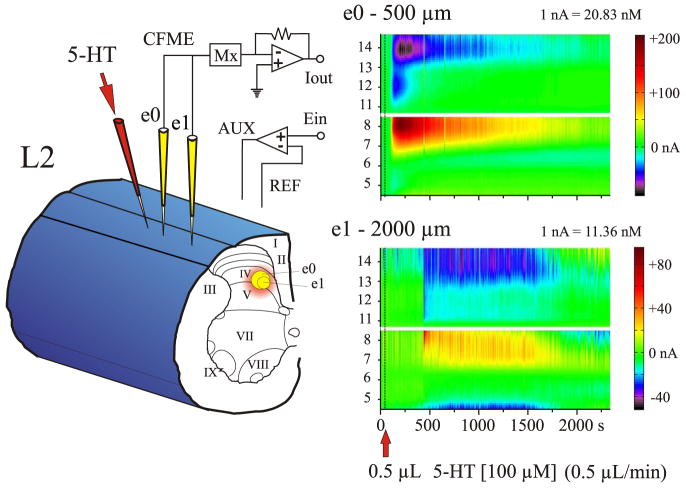
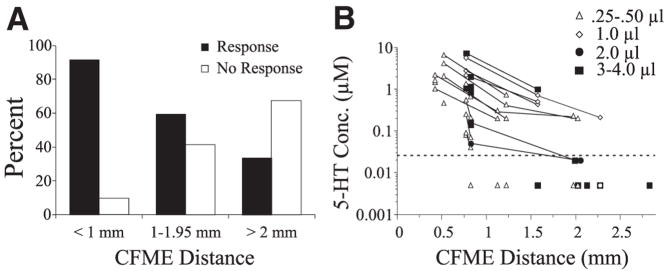
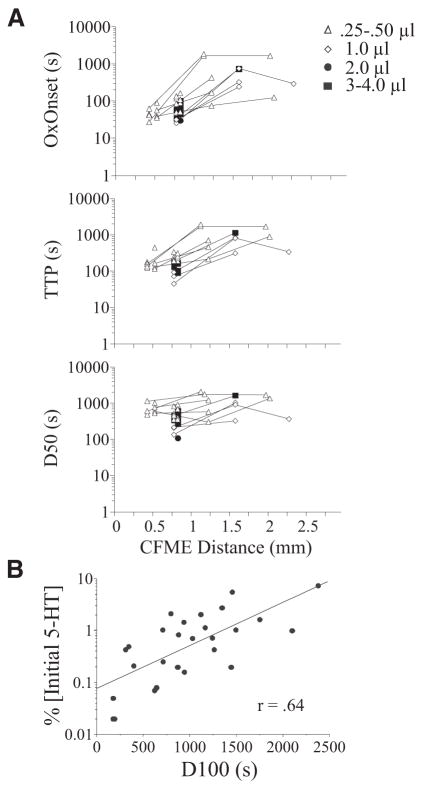
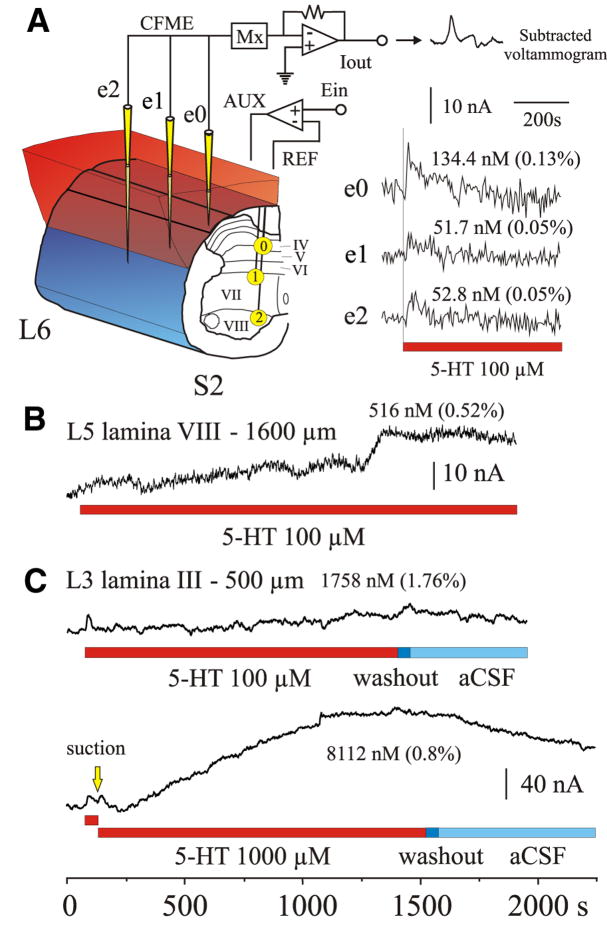
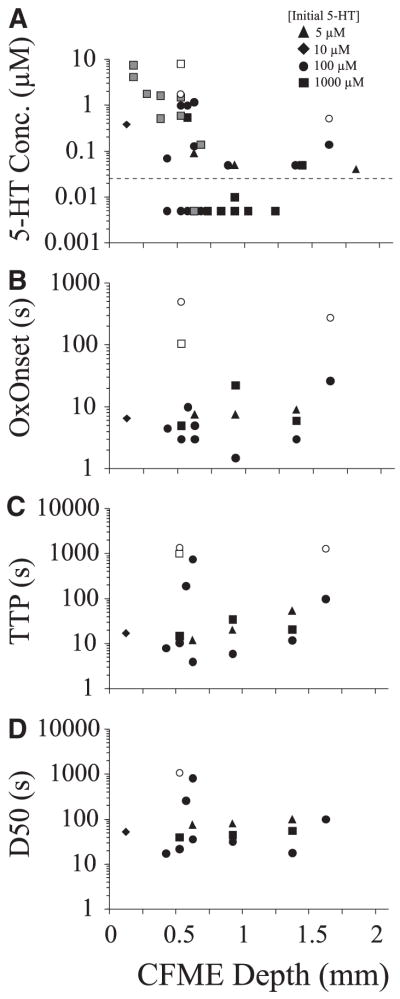
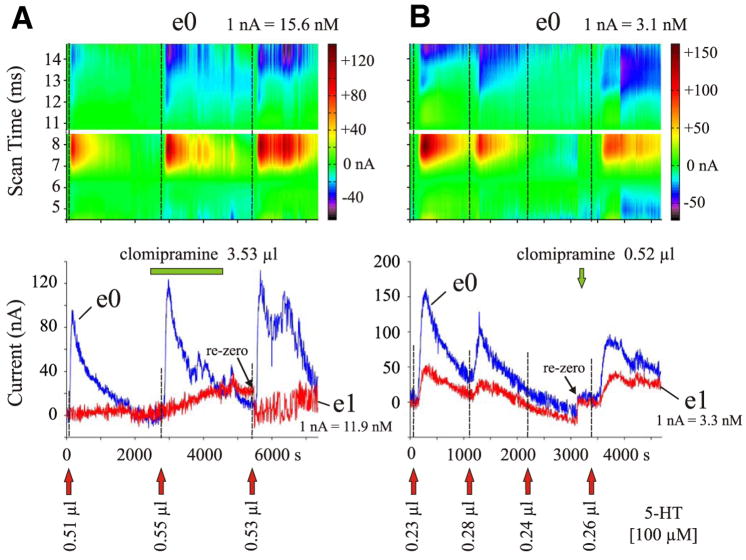
Application of neuroactive substances, including monoamines, is common in studies examining the spinal mechanisms of sensation and behavior. However, affected regions and time courses of transmitter activity are uncertain. We measured the spatial and temporal distribution of serotonin [5-hydroxytryptamine (5-HT)] in the lumbosacral spinal cord of halothane-anesthetized adult rats, following its intraspinal microinjection or surface application. Carbon fiber microelectrodes (CFMEs) were positioned at various locations in the spinal cord and oxidation currents corresponding to extracellular 5-HT were measured by fast cyclic voltammetry. Intraspinal microinjection of 5-HT (100 microM, 1-3 microl) produced responses that were most pronounced at CFMEs positioned <or=800 microm from the drug micropipette: 5-HT concentration was significantly higher (1.43 vs. <0.28% of initial concentration) and response latency was shorter (67.1 vs. 598.2 s) compared with more distantly positioned CFMEs. Treatment with the selective 5-HT reuptake inhibitor clomipramine only slightly affected the spread of microinjected 5-HT. Surface application over several segments led to a transient rise in concentration that was usually apparent within 30 s and was dramatically attenuated with increasing depth: 0.25% of initial concentration (1 mM) within 400 microm of the dorsal surface and <0.001% between 1,170 and 2,000 microm. This initial response to superfusion was sometimes followed by a gradual increase to a new concentration plateau. In sum, compared with bath application, microinjection can deliver about tenfold higher transmitter concentrations, but to much more restricted areas of the spinal cord.


Figures

FIG. 1
FIG. 1
Postexperimental in vitro calibration of carbon fiber microelectrodes (CFMEs) with 5-hydroxytryptamine (5-HT; serotonin) and the 5-HT reuptake inhibitor clomipramine. A: triangular input waveform or scan indicating both the oxidation (Ox) and reduction (R) phases, subtracted voltammograms for different concentrations of 5-HT, full signals obtained before and after the addition of 5-HT (overlaid) illustrating current changes due to the oxidation and reduction of 5-HT, and a subtracted voltammogram for clomipramine, illustrating oxidation and reduction currents. Dashed line indicates where the peak oxidation of 5-HT typically occurs. Note double and single reduction peaks (arrowheads) for 5-HT and clomipramine, respectively. B: average oxidation currents (±SE) evoked by different concentrations of 5-HT for electrodes used in microinjection experiments. Note linearity of response. C: color raster plot of 5-HT obtained during a postexperimental calibration. Each individually subtracted voltammogram is positioned according to its acquisition time during the trial (scanned at 2 Hz). Current generated during each scan was color coded (scale illustrated on the right) to evaluate the evolving response to increasing concentrations of 5-HT. Raster plot illustrates selected regions of the voltammogram (as indicated in A: red and blue bars), with the bottom half of the plot showing oxidation currents (in yellow and red) and the top half of the plot showing corresponding reduction currents (in blue, purple, and black). Note that 5-HT evokes a single oxidation current and 2 postoxidation reduction currents, and that the oxidation peak widens and the reduction peaks deepen as the concentration is increased. D: color raster plot for differing concentrations of clomipramine. Note the single oxidation and reduction peaks.
FIG. 2
FIG. 2
Experimental trial of 5-HT microinjection into the spinal cord. Left: 2 CFMEs, e0 and e1 (yellow), and the 5-HT micropipette (red) were lowered into lamina IV of the L2 spinal segment. e0 was 500 μm and e1 was 2,000 μm away from the 5-HT micropipette. Right: color representations showing serotonergic redox signals at e0 and e1 after microinjection of 0.5 μl (dashed line) of 100 μM 5-HT over 1 min. Note that 5-HT was detected sooner and at a much higher concentration by e0 compared with e1.
FIG. 3
FIG. 3
Spread of 5-HT (100 μM) through the spinal cord measured at different distances from the site of microinjection. A: percentage of CFMEs that showed a 5-HT oxidation current (response vs. nonresponse). CFMEs were positioned <1 mm away (Close), between 1 and 2 mm away (Intermediate) or ≥2 mm away (Far) from the injection site. B: concentration of 5-HT detected as a function of distance. Symbols to the right denote volume of injected 5-HT (0.25– 4.0 μl). Responses of CFMEs during the same experimental trial are connected with a solid line. Note that the concentration diminishes rapidly with increasing distance. Observations below average detection threshold (dotted line) indicated at “0.005 μM” are included, providing that 5-HT was detected with other electrodes in the same trial.
FIG. 4
FIG. 4
Diffusion parameters of 5-HT within the spinal cord after microinjection (100 μM). A: relationships between oxidation onset (OxOnset), time-to-peak (TTP), and latency to 50% decay (D50) of 5-HT oxidation current and distance from site of microinjection of 5-HT. Symbols to the right denote volume injected (0.25– 4.0 μl). B: positive relationship between 5-HT concentration (% initial 5-HT) and latency to 100% decay (D100) of 5-HT oxidation current (r = 0.64).
FIG. 5
FIG. 5
5-HT superfusion of the dorsal surface of the spinal cord. A, left: 3 CFMEs (yellow) were positioned in caudal spinal segments L6, S1, and S2. Electrodes were placed into laminae IV (e0), VII (e1), and VIII (e2). Shortest distance from the CFME tip to the spinal cord surface exposed by the laminectomy was 600, 900, and 1,350 μm for e0, e1, and e2, respectively. Right: shortly after application of 100 μM 5-HT, concentrations increased within the spinal cord as determined by oxidation of 5-HT at all CFMEs (see sample voltammogram). Peak oxidation current amplitude is plotted for each electrode. This early response peaked within 4–12 s of application and gradually returned to baseline. Maximum concentrations and percentage of applied 5-HT concentration are indicated. Time of exposure to 5-HT in all panels is indicated by the red bar. B and C: peak oxidation current amplitude plots from 2 other experiments illustrating changes in 5-HT concentration (both early and late responses) to superfusion with either 100 or/and 1,000 μM 5-HT. Note the gradual increase in concentration with time after the initial response. A drop in concentration (C) was observed after washout. Washout of 5-HT is indicated by dark blue bar; artificial cerebrospinal fluid (aCSF) bathing medium indicated by light blue bar. Locations and electrode depth (from closest exposed surface area) are indicated, as is the peak concentration of 5-HT for the late response. Bottom trace shows that the early response could be reproduced with a second application of 5-HT [removed by suction (yellow arrow) between applications].
FIG. 6
FIG. 6
Response of CFMEs placed at various depths within the spinal cord to bath superfusion of 5-HT. Concentration detected (A), OxOnset (B), TTP (C), and D50 (D) are plotted relative to CFME depth from the closest exposed surface of the spinal cord. Symbols to the right denote concentration of applied 5-HT (5–1,000 μM). Closed symbols denote initial (early) responses; open symbols denote second (late) responses. For concentration detected, observations below average detection threshold (dotted line) indicated at “0.005 μM” are included, providing that 5-HT was detected with other electrodes in the same trial. In one experiment, electrodes in ventral locations were repositioned to more dorsal locations to obtain concentration measurements (gray symbols) and it was not known whether the values were from an early or late response.
FIG. 7
FIG. 7
5-HT peak oxidation currents of individual CFMEs before and after microinjection of clomipramine. A: 5-HT concentrations were measured with 2 electrodes, located 400 μm away (e0) and 1,150 μm away (e1) from the 5-HT and clomipramine micropipettes, in lamina III of spinal segment L6. Top: color raster plots of 5-HT redox currents for e0. Bottom: plot shows maximum peak oxidation currents for both electrodes. Microinjection of 3.53 μl clomipramine (100 μM) was preceded by one and followed by 2 separate 5-HT microinjections. Red arrows indicate when 5-HT (100 μM) was microinjected (0.50 μl/min each); the green bar indicates time of clomipramine application (0.1 μl/min). Note increase in amplitude and prolongation of response to 5-HT after clomipramine. B: microinjection of 0.52 μl clomipramine (10 μM, 0.5 μl/min; green arrow) preceded by 3 and followed by one 5-HT microinjection (100 μM, 0.25 μl/min; red arrows). In this experiment, CFMEs were located 750 μm away (e0) and 834 μm away (e1) from the 5-HT micropipette (located between the CFMEs in a fixed array), in lamina V of spinal segment L2. Clomipramine ejection electrode was positioned 400 μm away from e0 and 1,950 μm away from e1. Plots as in A. Repeated 5-HT microinjections given in close succession showed diminishing responses that were reinstated with administration of clomipramine.

Similar articles

Cited by

References

    1. Antri M, Orsal D, Barthe J-Y. Locomotor recovery in the chronic spinal rat: effects of long-term treatment with a 5-HT2 agonist. Eur J Neurosci. 2002;16:467– 476. - PubMed
    1. Armstrong-James M, Millar J. High-speed cyclic voltammetry and unit recording with carbon fibre microelectrodes. In: Marsden CA, editor. Measurement of Neurotransmitter Release In Vivo. Toronto: Wiley; 1984. pp. 209–226.
    1. Barbeau H, Rossignol S. Initiation and modulation of the locomotor pattern in the adult chronic spinal cat by noradrenergic, serotonergic, and dopaminergic drugs. Brain Res. 1991;546:250–260. - PubMed
    1. Bardin L, Bardin M, Lavarenne J, Eschalier A. Effect of intrathecal serotonin on nociception in rats: influence of the pain test used. Exp Brain Res. 1997;113:81– 87. - PubMed
    1. Binns BC, Huang Y, Goettl VM, Hackshaw KV, Stephens RL. Glutamate uptake is attenuated in spinal deep dorsal and ventral horn in the rat spinal nerve ligation model. Brain Res. 2005;1041:38– 47. - PubMed

Publication types

LinkOut - more resources