. 2007 Jul 18;27(29):7705-16.
doi: 10.1523/JNEUROSCI.0968-07.2007.

Endpoint stiffness of the arm is directionally tuned to instability in the environment

Affiliations

Endpoint stiffness of the arm is directionally tuned to instability in the environment

David W Franklin et al. J Neurosci. .

Abstract

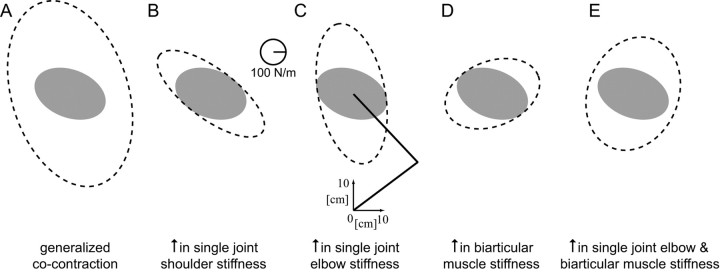
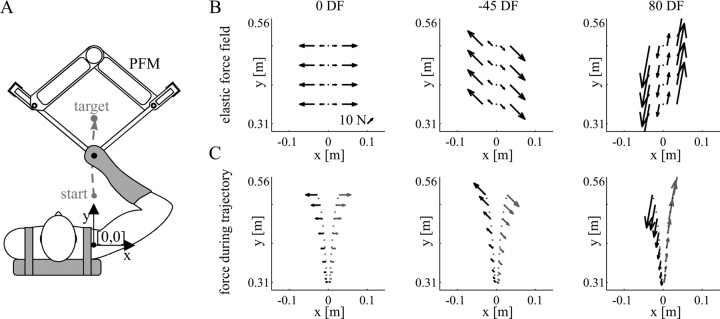
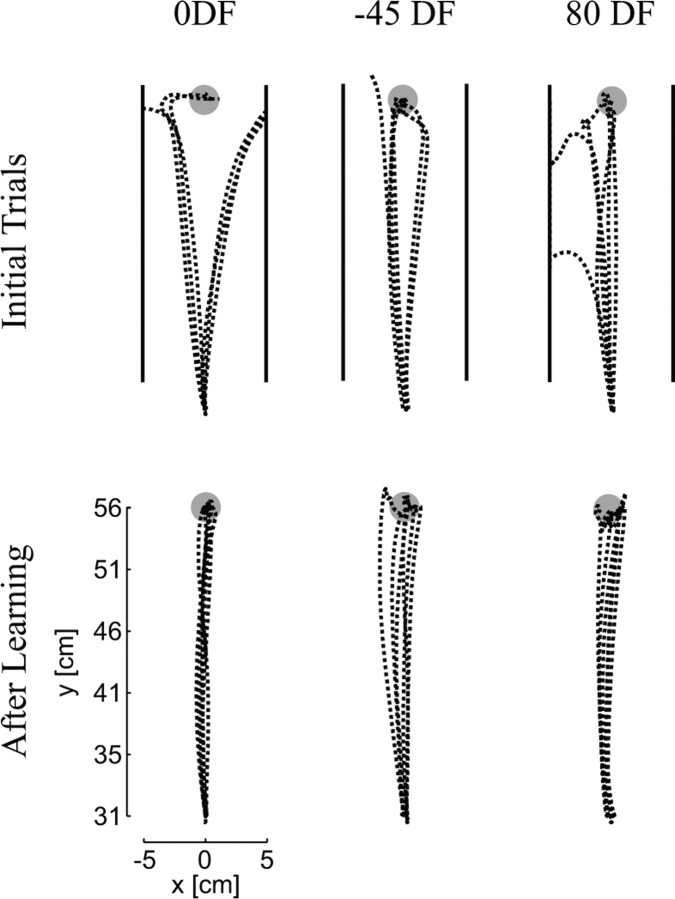
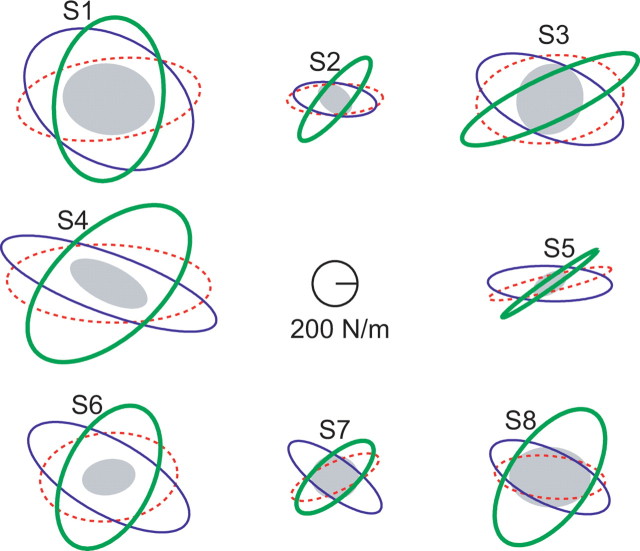
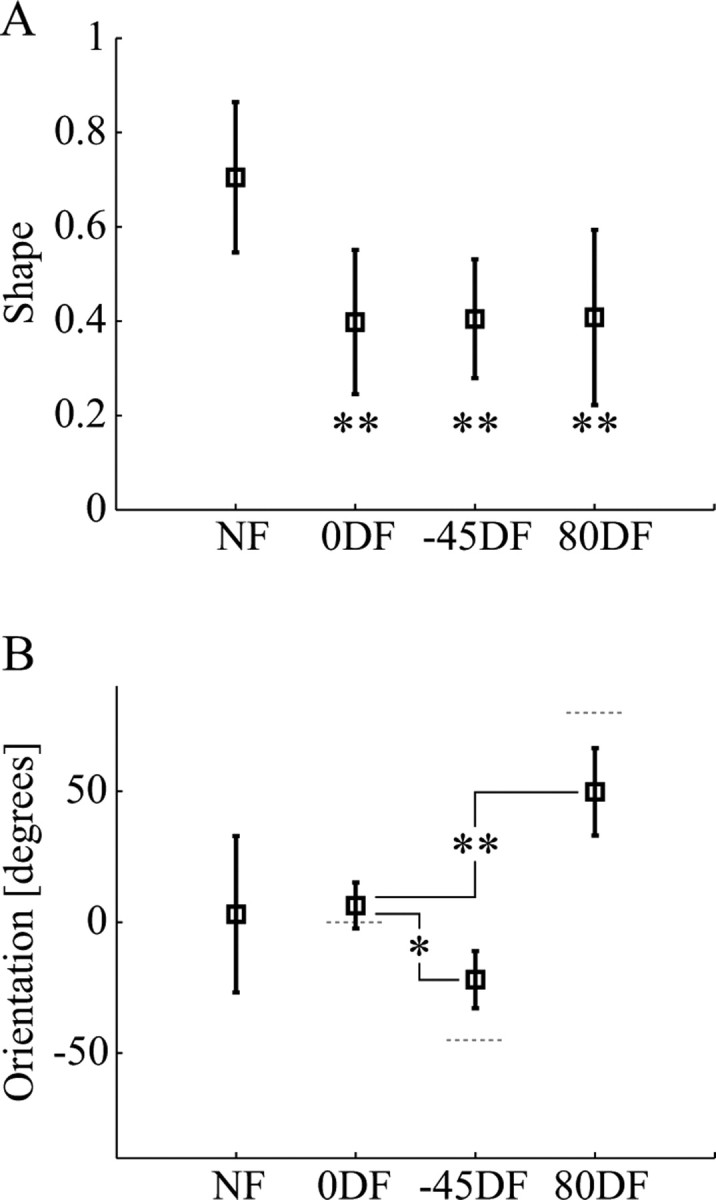
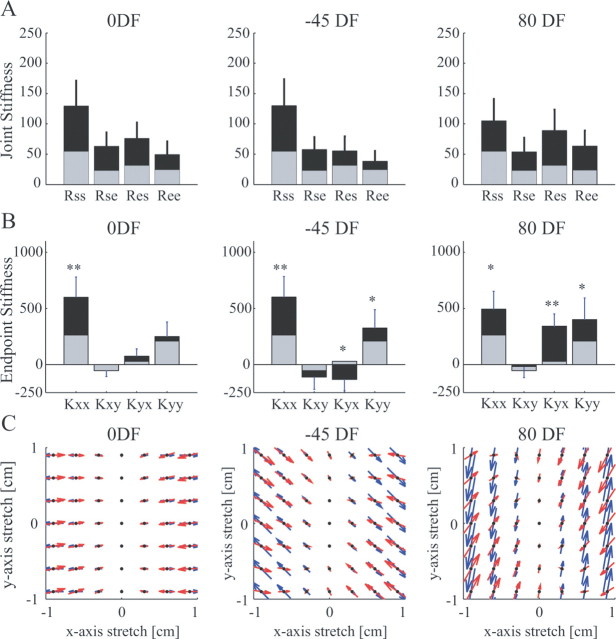
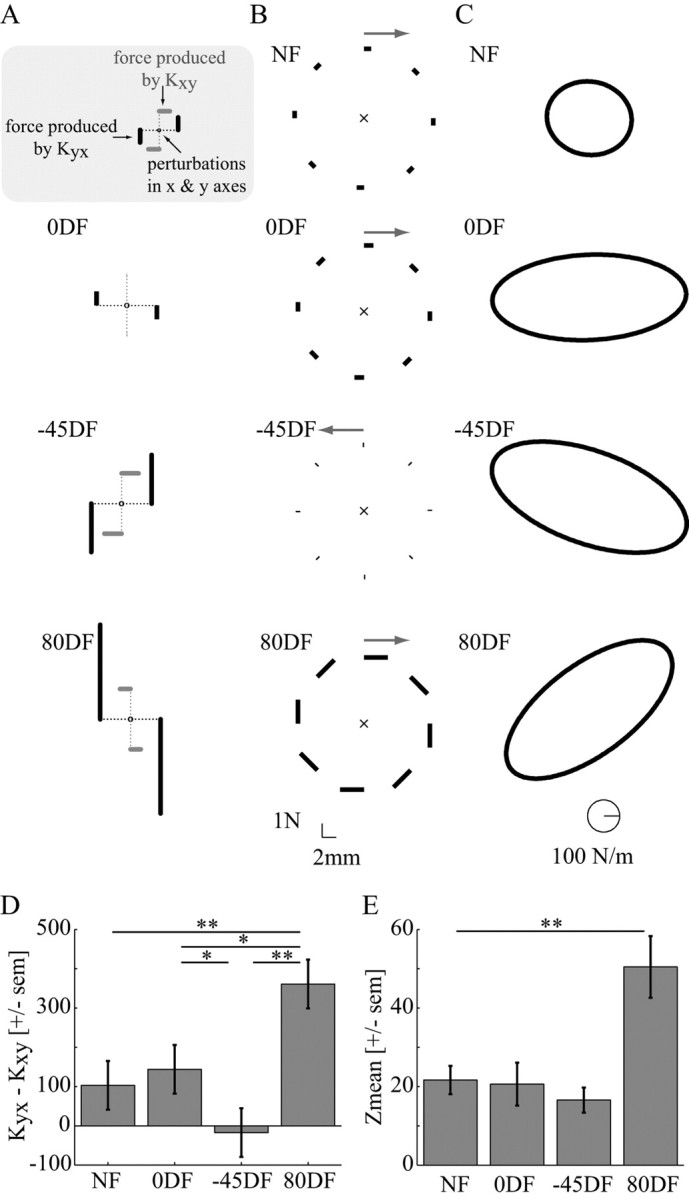
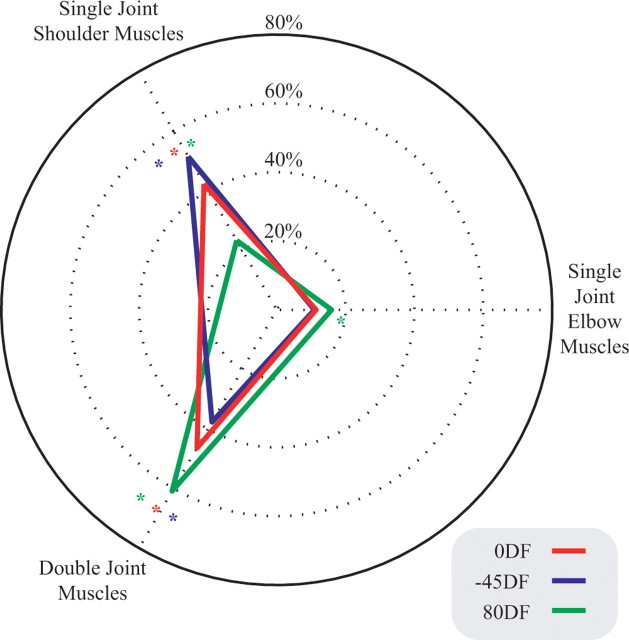
It has been shown that humans are able to selectively control the endpoint impedance of their arms when moving in an unstable environment. However, directional instability was only examined for the case in which the main contribution was from coactivation of biarticular muscles. The goal of this study was to examine whether, in general, the CNS activates the sets of muscles that contribute to selective control of impedance in particular directions. Subjects performed reaching movements in three differently oriented unstable environments generated by a robotic manipulandum. After subjects had learned to make relatively straight reaching movements in the unstable force field, the endpoint stiffness of the limb was measured at the midpoint of the movements. For each force field, the endpoint stiffness increased in a specific direction, whereas there was little change in stiffness in the orthogonal direction. The increase in stiffness was oriented along the direction of instability in the environment, which caused the major axis of the stiffness ellipse to rotate toward the instability in the environment. This study confirms that the CNS is able to control the endpoint impedance of the limbs and selectively adapt it to the environment. Furthermore, it supports the idea that the CNS incorporates an impedance controller that acts to ensure stability, reduce movement variability, and reduce metabolic cost.


Figures

Figure 1.
Figure 1.
Simulated changes in endpoint stiffness that would result from increasing the cocontraction of various muscle pairs. The mean NF stiffness ellipse for five subjects was used for baseline joint stiffness values (filled gray ellipse). Details of the simulations are given in Materials and Methods. The simulations were performed using the limb posture shown by the stick figure of the arm (C). A, Endpoint stiffness produced by global cocontraction of all muscles. B, Endpoint stiffness produced by cocontracting single-joint shoulder muscles. C, Endpoint stiffness produced by cocontracting single-joint elbow muscles. D, Endpoint stiffness produced by cocontracting biarticular muscles. E, Endpoint stiffness produced by cocontracting single-joint elbow and biarticular muscles.
Figure 2.
Figure 2.
Experimental setup. A, The subject's right arm was attached to the handle of the PFM with a custom-fitted thermoplastic cuff. Reaching movements were performed from a start position located at [0, 31] cm relative to the shoulder to a target located at [0, 56] cm. The PFM applied either a computer-controlled force field or controlled displacements to estimate stiffness during movement. B, Force produced by the three force fields: 0DF, −45DF, and 80DF (left to right). The force depended on the x-position of the subject's hand. As the hand position deviated either to the left or the right of the straight path joining the start and end targets, the force produced by the PFM increased. The direction in which the force pushed the hand was different for each field. C, Sample force patterns for two trajectories in each force field. Slightly diverging trajectories (shown in black dotted lines) result in widely different force patterns on the hand (compare black and gray arrows).
Figure 3.
Figure 3.
Trajectories before and after training. Initial trials in the 0DF, −45DF, and 80DF force fields were perturbed away from the straight path toward the target causing the hand to move outside of the safety zone (located at 5 cm to either side of the x-axis and represented by the solid back lines in the figure). Each field perturbed the arm in a slightly different direction. After training in the force fields for 75–150 trials, subjects were able to make straight (or gently curved) movements to the final target without being perturbed.
Figure 4.
Figure 4.
Endpoint stiffness was adapted differently in each force field. The stiffness ellipses for each of the eight subjects (S1–S8) participating in the study are shown for each of the four force fields (NF, filled gray; 0DF, dotted red; −45DF, blue; 80DF, thick green). Relative to the NF stiffness, the stiffness measured in the divergent force fields is larger and more anisotropic. The direction of the increased stiffness for each unstable force field is similar across all of the subjects. These directions are close to the directions of instability in the environment.
Figure 5.
Figure 5.
The characteristics of the endpoint stiffness were modified according to the instability in the environment. A, Changes in the shape of the endpoint stiffness ellipse in the four environments. Compared with the stiffness ellipse in the NF force fields, the stiffness ellipses in all three divergent fields were significantly more anisotropic, indicating that the endpoint stiffness had been selectively increased in a particular direction. Mean values across eight subjects with error bars indicating the SD are shown. Statistics indicate the results of Dunnett's t post hoc test of the difference relative to the NF (**p < 0.001). B, The orientation of the endpoint stiffness ellipse in the four environments. The variability in orientation of the NF stiffness is illustrated by the large SD. After subjects adapted to a divergent force field, the orientation shifted closer to the direction of the instability. Compared with the orientation of the 0DF stiffness ellipse, the −45DF stiffness ellipse rotated significantly in the counterclockwise direction, whereas the 80DF stiffness ellipse rotated significantly in the clockwise direction. Statistics indicate the results of Dunnett's t post hoc test of the difference relative to the DF (*p < 0.05; **p < 0.001). The orientation of the force field is indicated with the gray dotted line for each of the divergent fields.
Figure 6.
Figure 6.
Changes in the stiffness after force field adaptation relative to NF stiffness. A, Mean joint stiffness across subjects. Each panel shows the mean values for one of the divergent fields (black bars) compared with the NF (gray bars). Error bars give the SD across the eight subjects. B, Mean endpoint stiffness across subjects. Each panel shows the mean values for one of the divergent fields (black bars) compared with the NF (gray bars). Error bars give the SD across the eight subjects. Differences relative to NF stiffness were statistically tested using a paired t test (*p < 0.05; **p < 0.001). C, Change in endpoint stiffness after adaptation relative to the NF stiffness (ΔK = KFFKNF) represented as a force field under the assumption that the endpoint stiffness is independent of perturbation size is shown with the red arrows. Force vectors are plotted as a function of hand displacement, where the middle of the force vector (black dot) is the hand displacement value. Underneath, shown in blue arrows, the environmental force field imposed in the experiment is shown for the same set of hand displacements.
Figure 7.
Figure 7.
Symmetric and antisymmetric components of endpoint limb stiffness. A, Effect of the change in cross-terms of the endpoint stiffness matrix (Kxy and Kyx). For each of the three divergent force fields, the resulting change in the cross-terms relative to the original NF stiffness was calculated. The force (solid line) resulting from a 1 cm displacement (dotted line) was calculated for each of the ΔKxy (gray) and ΔKyx (black) terms. The Kxy terms after adaptation were not significantly different from the NF values and produced only small changes in force. Although the ΔKyx did not produce large forces in the 0DF field, it produced opposite effects in each of the −45DF and 80DF fields. These forces were directed to resist the oppositely directed forces from the divergent force field. B, The mean antisymmetric components of the limb stiffness for all four force fields. The force created by the antisymmetric component in response to a 10 mm displacement is displayed for eight equally spaced directions (calibration shown at the bottom). At the top of each figure, an arrow displays the direction of this curl component. C, The mean symmetric endpoint stiffness for each of the four force fields. The calibration is shown at the bottom of the figure. D, The difference in the cross-terms of the stiffness matrix (KyxKxy) is shown after adaptation to each force field. It is this difference that gives rise to the antisymmetric components of the endpoint stiffness. Statistics indicate the results of Tukey's HSD post hoc test. (*p < 0.05; **p < 0.001). E, The relative contribution of the antisymmetric component of the endpoint stiffness compared with the overall symmetric forces. The Zmean and SEM are shown for each of the four force fields. Statistics indicate the results of the Dunnett's t post hoc test testing the difference of each group from the NF results (**p = 0.001).
Figure 8.
Figure 8.
Unique changes in EMG during movements in each of the three unstable force fields. For each force field, the increase in muscle pair activity relative to NF activity has been plotted as a percentage such that the total change in activity for the three muscle pairs sums to 100%. For each muscle pair, a significant difference for a given force field compared with the other force fields, as determined using post hoc analysis (Tukey's HSD), is indicated in the corresponding color (*p < 0.05). The figure shows the average values for the five subjects.
Figure 9.
Figure 9.
The relative increase in EMG changes during movement. A, Changes in muscle activity over time in the 0DF. The relative change in the muscle activity is shown for each 100 ms time interval during the movement. As the hand moved away from the body, the difference in biarticular muscle activity decreased, and that of single-joint shoulder muscle activation increased, relative to NF activity. This can be seen as a smooth transformation in the location and shape of the triangle representing the relative muscle contributions. B, Changes in muscle activity over time in the 80DF. C, Changes in muscle activity over time in the 45DF. Both showed similar patterns to changes in the 0DF. Significant differences in the relative EMG activity for the shoulder, elbow, or biarticular muscles throughout the movement were tested with an ANCOVA with interval as the covariate. Significant main effects of the covariate are indicated (*p < 0.05; **p < 0.001). Under conditions in which one muscle group significantly decreased its relative activity over the interval while another muscle group increased its relative activity, this change is shown with the colored arrow. The figure shows the average results across all five subjects.

References

    1. Burdet E, Osu R, Franklin DW, Yoshioka T, Milner TE, Kawato M. A method for measuring endpoint stiffness during multi-joint arm movements. J Biomech. 2000;33:1705–1709. - PubMed
    1. Burdet E, Osu R, Franklin DW, Milner TE, Kawato M. The central nervous system stabilizes unstable dynamics by learning optimal impedance. Nature. 2001;414:446–449. - PubMed
    1. Burdet E, Tee KP, Mareels I, Milner TE, Chew CM, Franklin DW, Osu R, Kawato M. Stability and motor adaptation in human arm movements. Biol Cybern. 2006;94:20–32. - PubMed
    1. Darainy M, Malfait N, Gribble PL, Towhidkhah F, Ostry DJ. Learning to control arm stiffness under static conditions. J Neurophysiol. 2004;92:3344–3350. - PubMed
    1. Franklin DW, Milner TE. Adaptive control of stiffness to stabilize hand position with large loads. Exp Brain Res. 2003;152:211–220. - PubMed

Publication types

LinkOut - more resources