. 2007 Jul 18;27(29):7786-98.
doi: 10.1523/JNEUROSCI.1807-07.2007.

Physiologically distinct temporal cohorts of cortical interneurons arise from telencephalic Olig2-expressing precursors

Affiliations

Physiologically distinct temporal cohorts of cortical interneurons arise from telencephalic Olig2-expressing precursors

Goichi Miyoshi et al. J Neurosci. .

Abstract

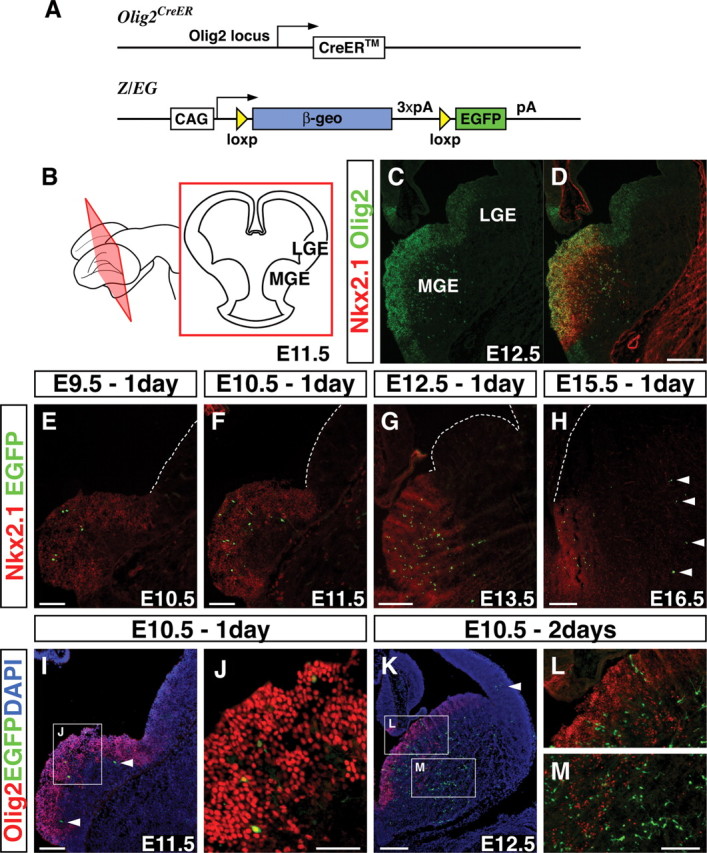
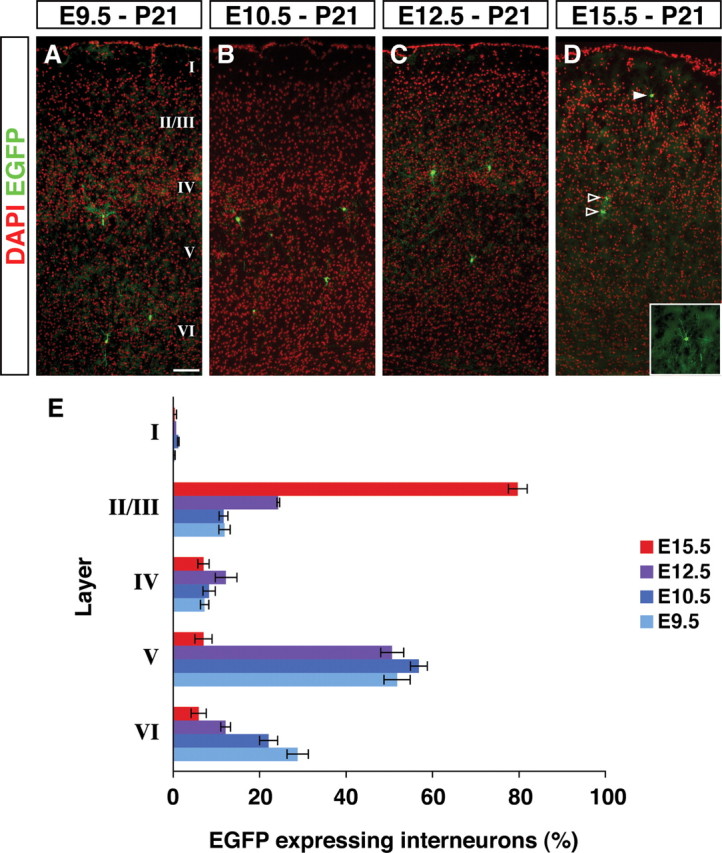
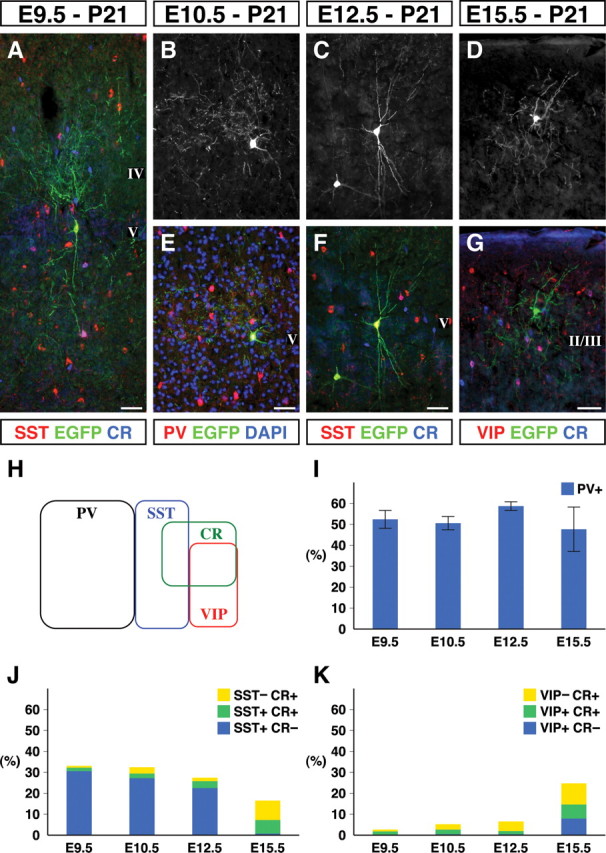
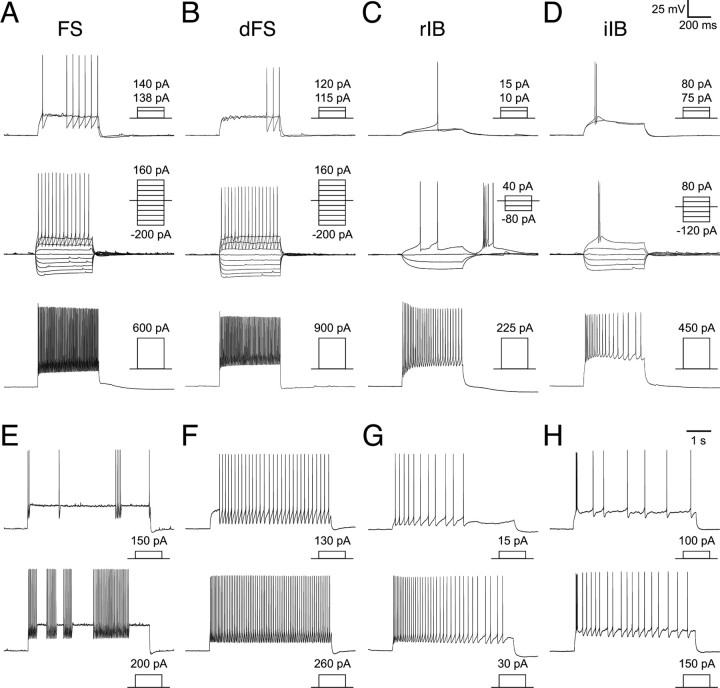
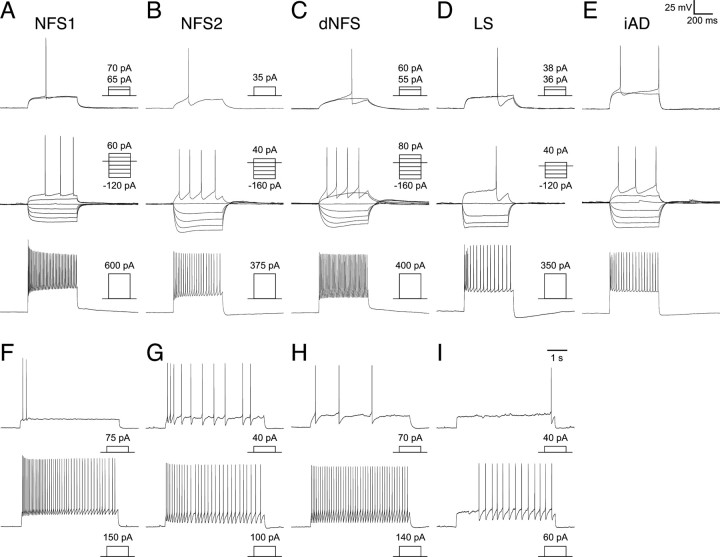
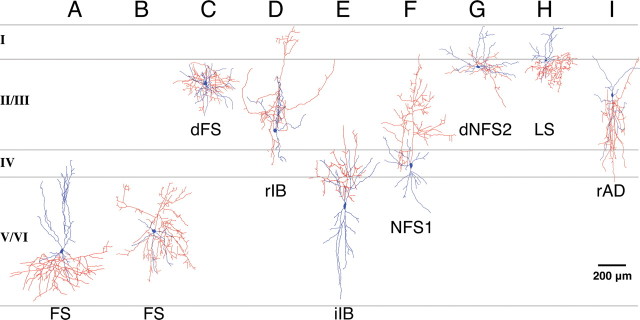
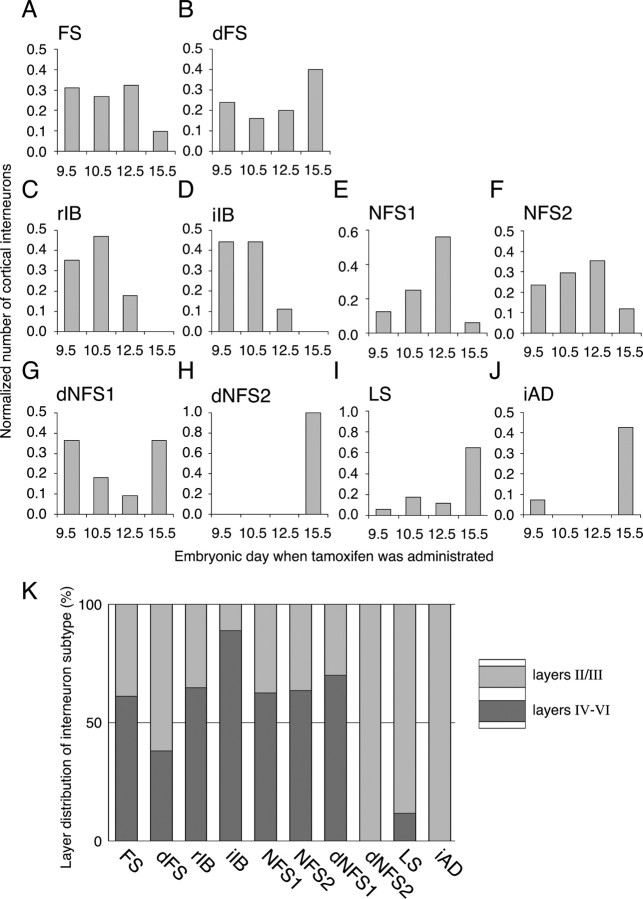
Inhibitory GABAergic interneurons of the mouse neocortex are a highly heterogeneous population of neurons that originate from the ventral telencephalon and migrate tangentially up into the developing cortical plate. The majority of cortical interneurons arise from a transient embryonic structure known as the medial ganglionic eminence (MGE), but how the remarkable diversity is specified in this region is not known. We have taken a genetic fate mapping strategy to elucidate the temporal origins of cortical interneuron subtypes within the MGE. We used an inducible form of Cre under the regulation of Olig2, a basic helix-loop-helix transcription factor highly expressed in neural progenitors of the MGE. We observe that the physiological subtypes of cortical interneurons are, to a large degree, unique to their time point of generation.


Figures

Figure 1.
Figure 1.
Temporally regulated genetic fate mapping of the Olig2high precursors. A, A schematic showing the genetic fate-mapping strategy used in the experiments by combining the Olig2-CreER driver and the Z/EG reporter lines. CAG, Hybrid promoter; pA, polyadenylation signal. B, Schematic of the E11.5 brain with a coronal section showing the location of the MGE and the LGE. C, D, Olig2 is expressed in the VZ progenitors at high levels within the Nkx2.1-expressing domain but only weakly in the Nkx2.1-negative domain of the ventral telencephalon. E–H, By administrating 4 mg (E9.5, E10.5, E12.5) or 5 mg (E15.5) of tamoxifen to timed pregnant mothers at E9.5 (E), E10.5 (F), E12.5 (G), and E15.5 (H) and analyzing 1 d later, labeled EGFP-expressing cells were found within the Nkx2.1-expressing domain. After E15.5 tamoxifen administration, some cells in the mantle were also labeled where Olig2 is expressed at this stage (H, arrowheads) (see also supplemental Fig. 1, available at www.jneurosci.org as supplemental material). I, J, At E11.5, 1 d after tamoxifen administration at E10.5, many labeled cells are Olig2 positive (I; high magnification in J). However, a few cells have already downregulated Olig2 by this time point (I, arrowheads). K, Two days after tamoxifen administration at E10.5, some labeled cells have already migrated into the cortex (arrowhead). Many EGFP-positive cells do not coexpress Olig2 2 d after tamoxifen administration (K), suggesting that these cells have already downregulated Olig2 (K–M). L, M, High magnifications of the regions in K. Scale bars: C, D, G, H, K, 200 μm; E, F, I, L, M, 100 μm; J, 50 μm.
Figure 2.
Figure 2.
Early and late fate-mapped cortical interneurons follow an inside-out layering pattern. Layering of the fate-mapped cortical interneurons within the P21 somatosensory barrel field was analyzed. A–D, Representative examples of sections are shown from tamoxifen administration at E9.5 (A), E10.5 (B), E12.5 (C), and E15.5 (D). Analysis has been done based on the cortical layers shown by DAPI nuclear staining (pseudocolored in red) and EGFP immunostaining (green). Cells with interneuron morphologies (D, filled arrowhead and inset) were analyzed for their molecular expression and physiological character, but the glial cells (D, open arrowheads) were not considered further in our analysis. E, The layer distribution of cortical interneurons fate mapped from each embryonic time point were analyzed. Fate-mapped interneurons followed an early-deep and late-superficial trend. Error bars indicate SE. Scale bar, 100 μm.
Figure 3.
Figure 3.
The morphologies and the molecular expression profiles of fate-mapped cortical interneurons. A–G, Images of mature fate-mapped cortical interneurons were visualized by their EGFP expression at P21 after tamoxifen administration at E9.5 (A), E10.5 (B, E), E12.5 (C, F), and E15.5 (D, G). These experiments resulted in the labeling of various interneuron subtypes including, SST+/CR− Martinotti cells (A, C, F), PV+ basket cells (B, E), and VIP−/CR− neurogliaform cells (D, G). Scale bars, 100 μm. H, The distribution of cortical interneuron markers at P21 in mouse somatosensory barrel cortex. PV, SST and VIP are expressed in mutually exclusive populations, whereas the CR+ population somewhat overlapped, except for the PV+ interneuron population. Based on these four markers, interneurons can be subdivided into seven groups. I, The PV+ FS interneurons comprised ∼50% of fate-mapped interneurons at all the time points examined. J, The SST+/CR− subtype comprised 30% of the interneurons fate mapped at early time points but are almost completely absent in the E15.5 fate mapping. J, K, In contrast, the VIP+ and CR+ subtypes were not fate mapped at early time points but became more prominent at the E15.5 time point of fate mapping. Each value with an SE represents data collected from three brains.
Figure 4.
Figure 4.
Intrinsic electrophysiological profiles of the fate-mapped cortical interneurons: FS and IB interneuron subtypes. A–H, The response of four subtypes of fate-mapped interneurons of FS and IB classes to short-duration (500 ms) current steps (A–D) or prolonged (5 s) near threshold current injection (E–H). In A–D, short-duration current injection protocols tested threshold current injection (top), response to hyperpolarizing current injection (middle), and suprathreshold current injection (bottom) that elicited discharge of action potentials at a near maximal firing frequency. Profiles are shown for a classical FS interneuron (A) with a stuttering firing pattern (E); a dFS interneuron (B) with a continuous firing pattern (F); an rIB interneuron (C) that exhibits pronounced adaptation in firing frequency (C, G); and an iIB interneuron (D) that exhibits a burst of two to three spikes and then sporadic spikes or pronounced adaptation in firing frequency (D, H).
Figure 5.
Figure 5.
Intrinsic electrophysiological profiles of the fate-mapped cortical interneurons: NFS, LS, and iAD interneuron subtypes. As in Figure 4, the response of six subtypes of fate-mapped interneurons are described. Profiles are shown for an NFS1 interneuron (A, F) that showed adaptation in firing frequency; an NFS2 interneuron (B, G) showing biphasic AHPs and also showed adaptation in firing frequency; dNFS1 and dNFS2 interneurons (C, H) that varied in the degree of exhibiting adaptation in spike frequency; an LS interneuron that, in some case, showed pronounced initial adaptation in firing frequency and spike amplitude (D, I) but in others showed either a slight increase in firing frequency or no adaptation. E, iAD interneurons all analyzed have shown pronounced adaptation in both spike frequency and amplitude in the initial phase of the current injection.
Figure 6.
Figure 6.
Examples of the morphological diversity of the fate-mapped cortical interneurons. EGFP-expressing interneurons were recorded in all layers, and their morphologies were recovered and reconstructed using camera lucida. Axons and dendrites are indicated in red and blue, respectively. Examples are not representative of quantitative laminar distribution. A, B, Classical FS interneurons were recovered from all of the layers and exhibited an array of dendritic and axonal arbors. A large basket cell (A) and nest basket cell (B) are shown. C, dFS interneurons were mainly found in superficial layers. D, rIB interneurons were preferentially recorded from early fate-mapping time points and were located in both deep and superficial layers. E, iIB interneurons were preferentially located in deep layers and often had axons emerging from pial-side dendrites. F, A number of NFS1 interneurons were analyzed with early fate-mapped populations (E10.5–E12.5) exhibiting bitufted morphologies with ascending axons as in the case of NFS1 interneurons. G, dNFS2 interneurons exhibited prominent lateral dendritic and axonal arbours. H, LS neurogliaform interneurons were mainly located in superficial layers. I, Six interneurons of the total analyzed [example of a rapidly adapting interneuron (rAD) is shown] exhibited bipolar or double-bouquet morphologies and were not readily assigned to one of the 10 subtypes we have identified. The lamina location for all of the interneurons shown is approximate.
Figure 7.
Figure 7.
Temporal and lamina distribution of the fate-mapped interneuron subtypes. A–J, Histograms showing the normalized distribution of each cell type over the four time points of tamoxifen administration (E9.5, E10.5, E12.5, E15.5). A, B, Classical FS (A) and dFS (B) interneurons together; FS interneurons were the major class found in this study, representing ∼50% of fate-mapped interneurons at all time points examined. dFS interneurons were found more from the E15.5 fate mapping (B). C, D, rIB (C) and iIB (D) subtypes of interneurons were fate mapped from only early time points. E, F, Within two of the NFS interneurons, NFS1 (E) peaked at the E12.5 time point. G–J, Three subtypes of dNFS2 (H), LS (I), and iAD (J) interneurons were mainly found in the E15.5 fate mapping. dNFS1 (G) interneurons were the only subtype to exhibit a bimodal distribution. K, The location of interneurons in deep versus superficial laminar distribution primarily reflected the time point at which interneurons were fate mapped. Interneuron subtypes predominantly fate mapped from the E15.5 time point (H–J) showed a preferential location in superficial layers (K).

Similar articles

Cited by

References

    1. Anderson SA, Eisenstat DD, Shi L, Rubenstein JL. Interneuron migration from basal forebrain to neocortex: dependence on Dlx genes. Science. 1997;278:474–476. - PubMed
    1. Angevine JB, II, Sidman RL. Autoradiographic study of cell migration during histogenesis of cerebral cortex in the mouse. Nature. 1961;192:766–768. - PubMed
    1. Bertrand N, Castro DS, Guillemot F. Proneural genes and the specification of neural cell types. Nat Rev Neurosci. 2002;3:517–530. - PubMed
    1. Butt SJ, Fuccillo M, Nery S, Noctor S, Kriegstein A, Corbin JG, Fishell G. The temporal and spatial origins of cortical interneurons predict their physiological subtype. Neuron. 2005;48:591–604. - PubMed
    1. Cauli B, Audinat E, Lambolez B, Angulo MC, Ropert N, Tsuzuki K, Hestrin S, Rossier J. Molecular and physiological diversity of cortical nonpyramidal cells. J Neurosci. 1997;17:3894–3906. - PMC - PubMed

Publication types

MeSH terms

Substances