. 2007 Jul 18;27(29):7817-26.
doi: 10.1523/JNEUROSCI.1026-07.2007.

The secreted beta-amyloid precursor protein ectodomain APPs alpha is sufficient to rescue the anatomical, behavioral, and electrophysiological abnormalities of APP-deficient mice

Affiliations

The secreted beta-amyloid precursor protein ectodomain APPs alpha is sufficient to rescue the anatomical, behavioral, and electrophysiological abnormalities of APP-deficient mice

Sabine Ring et al. J Neurosci. .

Abstract

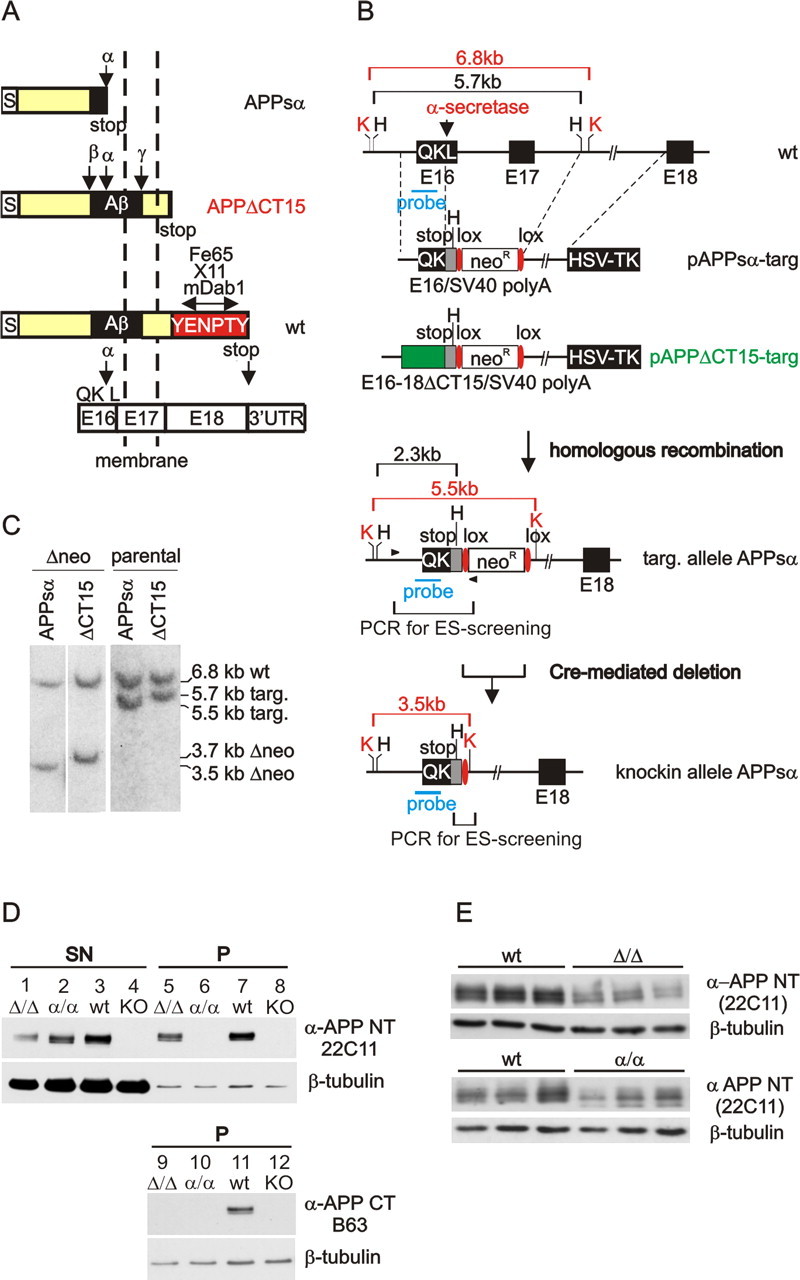
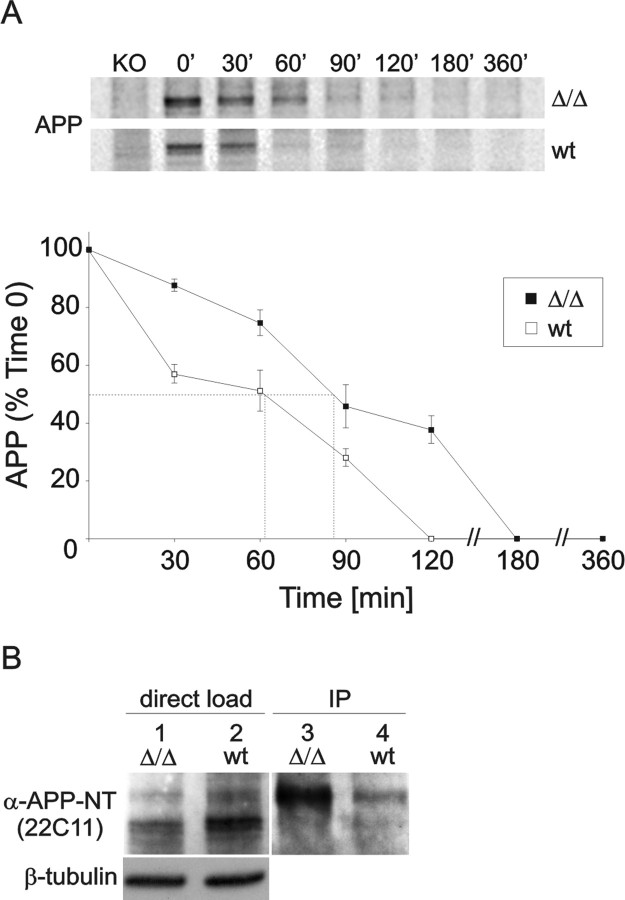
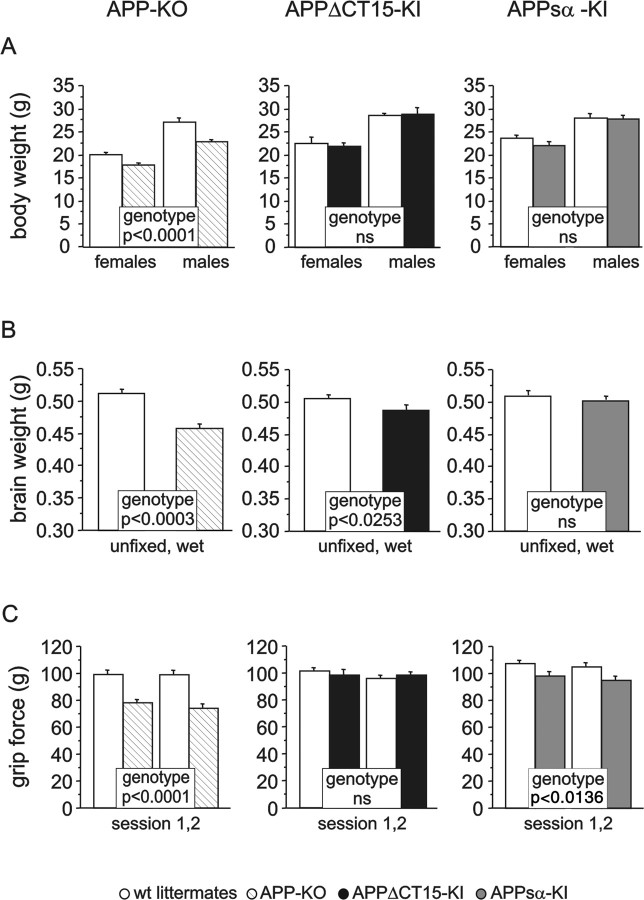
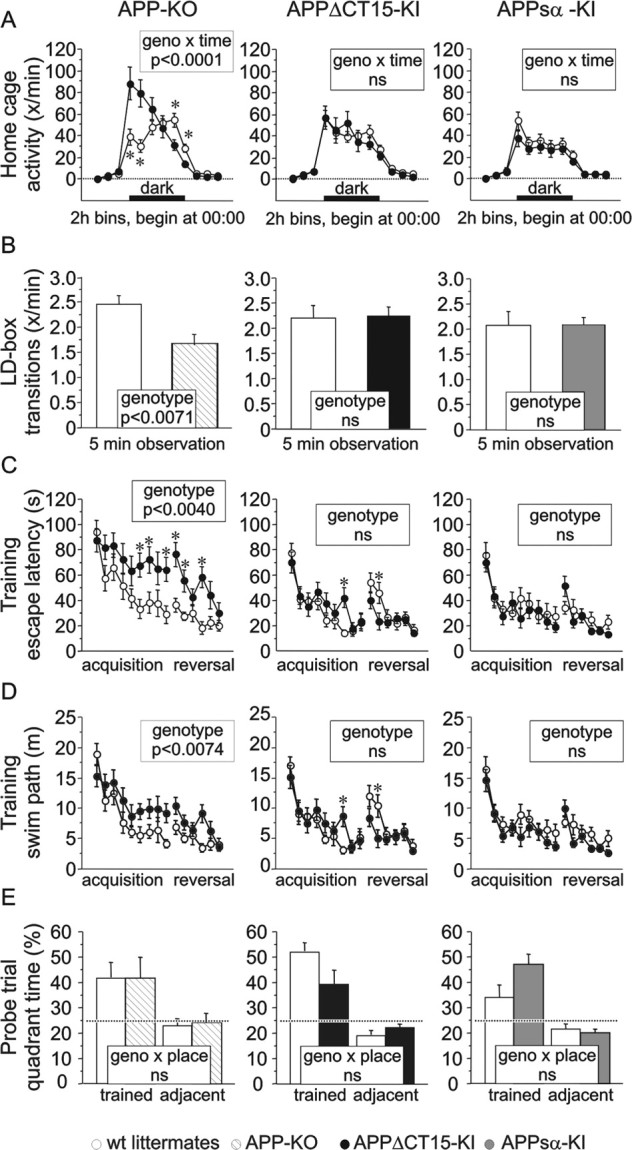
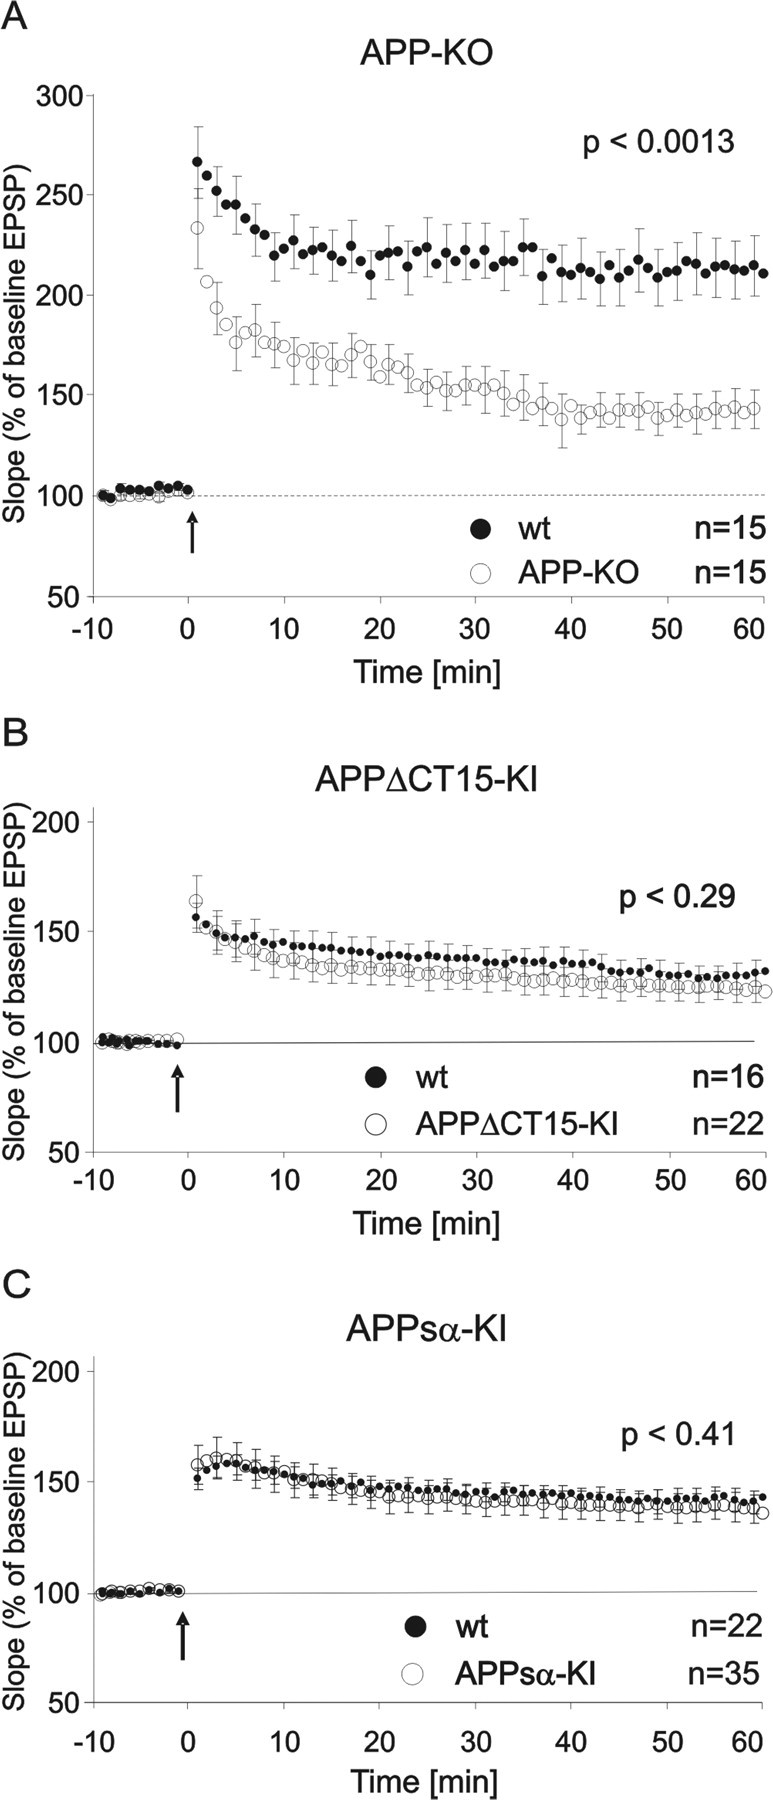
It is well established that the proteolytic processing of the beta-amyloid precursor protein (APP) generates beta-amyloid (Abeta), which plays a central role in the pathogenesis of Alzheimer's disease (AD). In contrast, the physiological role of APP and of its numerous proteolytic fragments and the question of whether a loss of these functions contributes to AD are still unknown. To address this question, we replaced the endogenous APP locus by gene-targeted alleles and generated two lines of knock-in mice that exclusively express APP deletion variants corresponding either to the secreted APP ectodomain (APPs alpha) or to a C-terminal (CT) truncation lacking the YENPTY interaction motif (APPdeltaCT15). Interestingly, the deltaCT15 deletion resulted in reduced turnover of holoAPP, increased cell surface expression, and strongly reduced Abeta levels in brain, likely because of reduced processing in the endocytic pathway. Most importantly, we demonstrate that in both APP knock-in lines the expression of APP N-terminal domains either grossly attenuated or completely rescued the prominent deficits of APP knock-out mice, such as reductions in brain and body weight, grip strength deficits, alterations in circadian locomotor activity, exploratory activity, and the impairment in spatial learning and long-term potentiation. Together, our data suggest that the APP C terminus is dispensable and that APPs alpha is sufficient to mediate the physiological functions of APP assessed by these tests.


Figures

Figure 1.
Figure 1.
Generation of knock-in mice. A, Schematic representation (not to scale) of APP-KI variants APPsα-KI and APPΔCT15-KI. Open boxes represent exons (E16, E17, E18) encoding the APP C terminus; S, signal peptide. B, The short arm of pAPPsα-targ encompasses exon 16 into which a stop codon was introduced behind the α-secretase site. In pAPPΔCT15-targ the coding sequence of exon 16 was fused to APP695-cDNA sequences up to amino acid 680 (E16–18ΔCT15; green box) flanked by a stop codon. The stop codon was followed by a SV40 polyA site (gray box) and a floxed neo gene for selection in ES cells. The long arm of homology consists of a 6.2 kb intronic fragment downstream of exon 17. Subsequently, the neo gene was deleted by transient expression of Cre-recombinase (B, bottom). K, KpnI; H, HindIII. C, Correct gene targeting and removal of the neo gene (Δneo) was confirmed by Southern blotting with a 0.6 kb probe overlapping exon 16 (B, probe). KpnI digestion of ES cell DNA revealed expected bands of 6.8 kb (wt), 3.5 kb (APPsα-allele), and 3.7 kb (APPΔCT15 allele). D, Western blot analysis (N-terminal antibody 22C11) of soluble APPs and membrane-bound holoAPP from adult brain revealed in pellet fractions (P) from wt mice the typical set of bands expected for holoAPP (lane 7) and a similar set of bands for APPΔCT15-KI mice (lane 5). No membrane-bound APP was detected in pellet fractions of APPsα-KI mice (lane 6). In supernatant fractions (SN) soluble APPs derived from APPsα-KI brain co-migrated with APPs produced in wt or APPΔCT15-KI brains (lanes 1–3). As expected, no signal was detectable with a C-terminal antibody for either KI variant (lanes 9, 10). As a negative control APP-KO brain was used (lanes 4, 8, 12), and β-tubulin staining was performed to monitor loading. E, Western blot analysis of whole-brain homogenates of APP-KI mutants (25 μg of protein/lane), using an N-terminal anti-APP antibody (22C11). Note that quantification revealed for APPΔCT15-KI brain a significant reduction of APP expression. A similar, but not significant, trend was observed for APPsα-KI mice (see Results for details).
Figure 2.
Figure 2.
Turnover of full-length APP and cell surface expression. A, Turnover of endogenous cell-bound APP. APPΔCT15-KI and wt MEFs were pulse-labeled with [35S]methionine/cysteine for 15 min and chased for the indicated time intervals. At time 0, APP consists predominantly of immature N-glycosylated species. Both the N-glycosylated and mature N- and O-glycosylated species are abundant at 30 min for both cell types. After a 60–90 min chase period the APP level is reduced dramatically in wt MEFs and below detection level at 120 min. In contrast, in APPΔCT15-KI MEFs the APP expression is reduced to only 40% after a 120 min chase period. Half-life was determined by quantitating the results as indicated by dotted lines (B). All values are presented as the means ± SEM. Differences were detected with two-tailed Student's t test, accepting p < 0.05 as significant. B, Biotinylation of surface APP. APPΔCT15-KI and wt MEFs were surface-biotinylated for 30 min. Cell lysate (15 μg/lane) was loaded directly onto a 10% Tris-tricine gel (lanes 1, 2) or was immunoprecipitated (350 μg/immunoprecipitate) by using NeutrAvidin-agarose beads (lanes 3, 4). APP was detected with the use of an N-terminal anti-APP antibody (22C11), revealing a considerable increase of surface APP in APPΔCT15-KI cells when compared with wt controls.
Figure 3.
Figure 3.
Somatic development and grip strength. A, Body weight measured at 2.4 months before water maze testing was reduced in APP-KO (13 KO and 15 wt) regardless of gender, but not in APPΔCT15-KI (17 KI and 16 wt) nor in APPsα-KI (17 KI and 16 wt) mice. ANOVA: genotype × line, F(2,58) = 5.1 (p < 0.0092); genotype × line × gender, F(2,58) = 1.3, ns. APP-KO: genotype, F(1,16) = 31.2 (p < 0.0001); genotype × gender, F(1,16) = 2.7, ns. APPΔCT15-KI: genotype, F(1,21) = 0.1, ns; genotype × gender, F(1,21) = 0.1, ns. APPsα-KI: genotype, F(1,21) = 0.7, ns; genotype × gender, F(1,21) = 0.8, ns. B, Brain weight at 10–12 months of age was strongly reduced in APP-KO mice (9 KO and 10 wt). This effect was attenuated in the APPΔCT15-KI (12 KI and 10 wt) and fully corrected in the APPsα-KI line (12 KI and 10 wt). ANOVA: genotype × line, F(1,29) = 4.9 (p < 0.0151). APP-KO: genotype, F(1,9) = 31.4 (p < 0.0003). APPΔCT15-KI: genotype, F(1,12) = 6.5 (p < 0.0253). APPsα-KI: genotype, F(1,8) = 0.3, ns. C, Grip strength was strongly reduced in APP-KO mice (13 KO and 15 wt) in both test sessions on consecutive days. This effect was fully corrected in the APPΔCT15-KI (17 KI and 16 wt) and attenuated in the APPsα-KI line (17 KI and 16 wt). ANOVA: genotype × line, F(2,58) = 9.0 (p < 0.0004); genotype × line × session, F(2,58) = 0.7, ns. APP-KO: genotype, F(1,16) = 52.4 (p < 0.0001); genotype × session, F(1,16) = 0.7, ns. APPΔCT15-KI: genotype, F(1,21) = 0.4, ns; genotype × session, F(1,21) = 0.3, ns. APPsα-KI: genotype, F(1,21) = 7.3 (p < 0.0136); genotype × session, F(1,21) = 1.3, ns.
Figure 4.
Figure 4.
Home cage activity, explorative activity, and spatial learning. A, In their home cages the APP-KO mice (13 KO and 14 wt) showed overshooting activity during the beginning of the dark phase. This effect was corrected in the APPΔCT15-KI (15 KI and 12 wt) as well as in the APPsα-KI line (15 KI and 18 wt). ANOVA: genotype × line, F(2,73) = 1.0, ns; genotype × time × line, F(22,803) = 3.8 (p < 0.0001). APP-KO: genotype, F(1,23) = 2.8, ns; genotype × time, F(11,253) = 10.3 (p < 0.0001). APPΔCT15-KI: genotype, F(1,23) = 0.1, ns; genotype × time, F(11,253) = 0.5, ns. APPsα-KI: genotype, F(1,27) = 0.1, ns; genotype × time, F(11,297) = 0.5, ns. B, In the light/dark box APP-KO mice showed significantly fewer transitions between the two compartments (F(1,24) = 9.8; p < 0.0071), indicative of reduced exploratory activity under aversive conditions. In contrast, both KI lines were statistically indistinguishable from wt littermate controls (APPΔCT15-KI, F(1,29) = 0.1, ns; APPsα-KI, F(1,29) = 0.1, ns). C, In the water maze place navigation task APP-KO mice (13 KO and 15 wt) took significantly longer than wt controls to find the hidden platform toward the end of acquisition training and during most of reversal training. Performance was similar to controls at the beginning and at the very end of testing. Neither APPΔCT15-KI (17 KI and 16 wt) nor APPsα-KI (17 KI and 16 wt) mice were impaired. APPΔCT15-KI had longer escape latencies during trial block 7 but were better than controls during trial block 11. ANOVA: genotype × line, F(2,58) = 6.8 (p < 0.0022); genotype × time, F(14,812) = 2.3 (p < 0.0051). APP-KO: genotype, F(1,16) = 11.3 (p < 0.0040); genotype × time, F(14,224) = 1.7 (p < 0.0662). APPΔCT15-KI: genotype, F(1,21) = 0.2, ns; genotype × time, F(14,294) = 1.9 (p < 0.0275). APPsα-KI: genotype, F(1,21) = 0.1, ns; genotype × time, F(14,294) = 1.0, ns. D, APP-KO mice also swam longer distances to reach the platform, whereas the two KI lines were unimpaired according to this criterion. APPΔCT15-KI had longer swim paths during trial block 7 but were better than controls during trial block 11. ANOVA: genotype × line, F(2,58) = 4.6 (p < 0.0146); genotype × time, F(14,812) = 2.0 (p < 0.0170). APP-KO: genotype, F(1,16) = 9.4 (p < 0.0074); time, F(14,224) = 13.8 (p < 0.0001); genotype × time, F(14,224) = 1.5, ns. APPΔCT15-KI: genotype, F(1,21) = 0.1, ns; time, F(14,294) = 10.9 (p < 0.0001); genotype × time, F(14,294) = 1.8 (p < 0.0376). APPsα-KI: genotype, F(1,21) = 1.0, ns; time, F(14,294) = 9.4 (p < 0.0001); genotype × time, F(14,294) = 0.8, ns. E, Probe trial performance was normal in all three lines. Time (percentage) spent in the trained quadrant was compared with average time (percentage) spent in the left and right adjacent quadrants. ANOVA: genotype × place × line, F(2,58) = 0.9, ns. APP-KO: place, F(1,16) = 4.8 (p < 0.0433); genotype × place, F(1,16) = 1.0, ns. APPΔCT15-KI: place, F(1,21) = 20.6 (p < 0.0002); genotype × place, F(1,16) = 1.3, ns. APPsα-KI: place, F(1,21) = 9.5 (p < 0.0056); genotype × place, F(1,21) = 0.3, ns.
Figure 5.
Figure 5.
LTP analysis in APP-KI. LTP of fEPSPs was induced in hippocampal slices by TBS (10 trains of 4 pulses at 100 Hz with an interburst interval of 200 μs, repeated 3×) after 20 min of 0.1 Hz test stimulation (arrow). A, Aged APP-KO mice (9–12 months) showed significantly lower rates of induction and maintenance of LTP than their wt littermates, expressed as a percentage of the mean slope before LTP induction (baseline). On testing for 60 min after TBS, the APP-KO mice showed a significantly reduced potentiation [wt, 212 ± 14.5 (n = 15); APP-KO, 142.8 ± 9.5 (n = 15); p < 0.0013]. B, Unlike APP-KO mice, aged APPΔCT15-KI mice (12–15 months) did not have LTP deficits relative to their wt littermates after 60 min [wt, 131.92 ± 6.07 (n = 16); APPΔCT15-KI, 124.94 ± 6.45 (n = 22)]. C, Neither did aged APPsα-KI mice show deficits in induction or maintenance of LTP after 60 min when compared with wt control animals [wt, 141.97 ± 5.25 (n = 22); APPsα-KI, 136.63 ± 6.96 (n = 35); filled circles, wt animals; open circles, KI animals]. All data are presented as the means ± SEM; Student's t test.

References

    1. Almkvist O, Basun H, Wagner SL, Rowe BA, Wahlund LO, Lannfelt L. Cerebrospinal fluid levels of alpha-secretase-cleaved soluble amyloid precursor protein mirror cognition in a Swedish family with Alzheimer disease and a gene mutation. Arch Neurol. 1997;54:641–644. - PubMed
    1. Anderson JJ, Holtz G, Baskin PP, Wang R, Mazzarelli L, Wagner SL, Menzaghi F. Reduced cerebrospinal fluid levels of alpha-secretase-cleaved amyloid precursor protein in aged rats: correlation with spatial memory deficits. Neuroscience. 1999;93:1409–1420. - PubMed
    1. Anliker B, Müller U. The functions of the mammalian amyloid precursor protein and related amyloid precursor-like proteins. Neurodegener Dis. 2006;3:239–246. - PubMed
    1. Bell KF, Zheng L, Fahrenholz F, Cuello AC. ADAM-10 over-expression increases cortical synaptogenesis. Neurobiol Aging. 2007 in press. - PubMed
    1. Bour A, Little S, Dodart JC, Kelche C, Mathis C. A secreted form of the beta-amyloid precursor protein (sAPP695) improves spatial recognition memory in OF1 mice. Neurobiol Learn Mem. 2004;81:27–38. - PubMed

Publication types

MeSH terms

Substances