. 2007 Jul 18;27(29):7827-37.
doi: 10.1523/JNEUROSCI.1644-07.2007.

Annonacin, a natural mitochondrial complex I inhibitor, causes tau pathology in cultured neurons

Affiliations

Annonacin, a natural mitochondrial complex I inhibitor, causes tau pathology in cultured neurons

Myriam Escobar-Khondiker et al. J Neurosci. .

Abstract

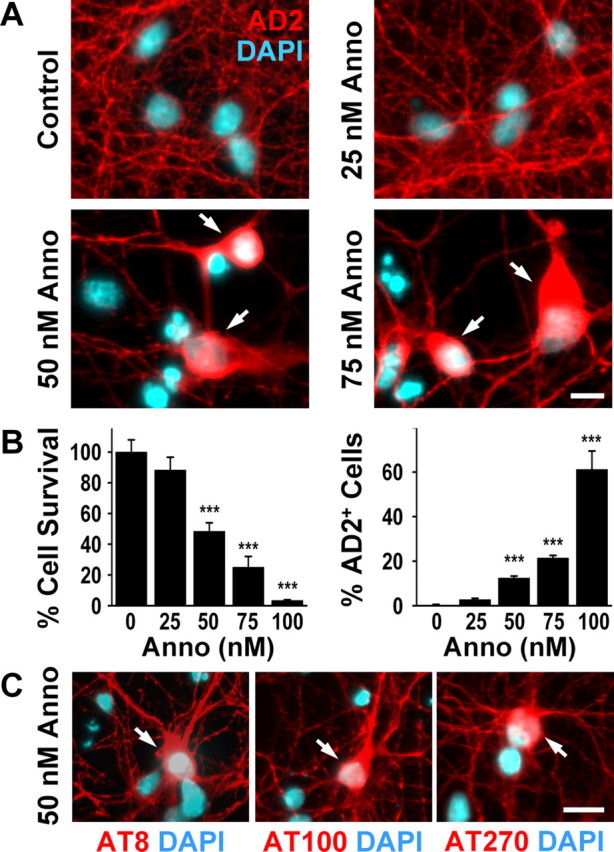
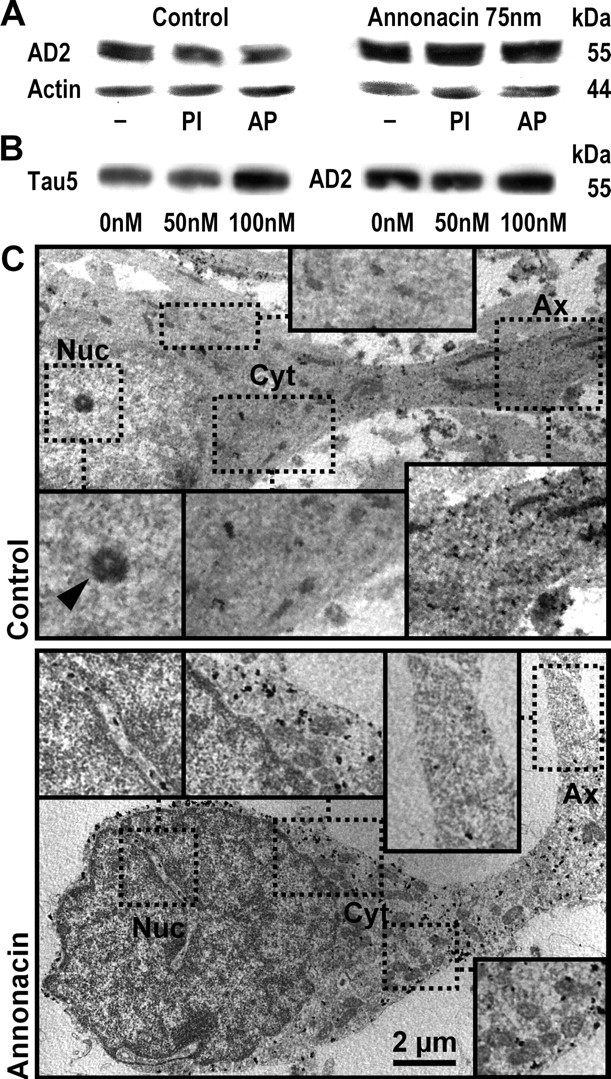
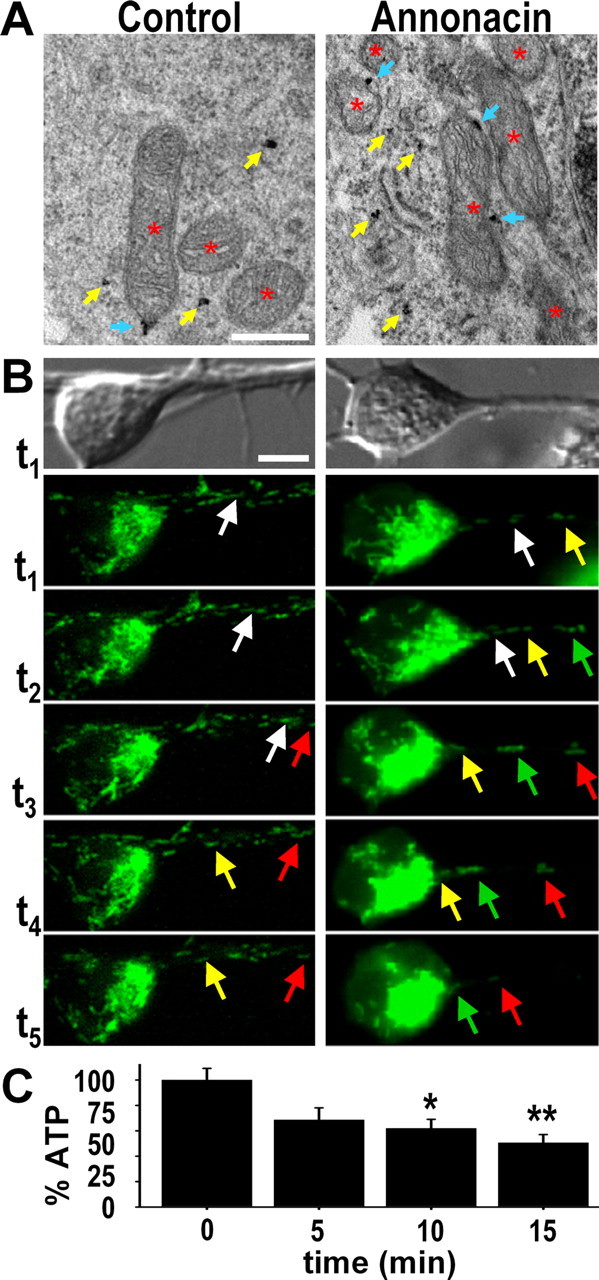
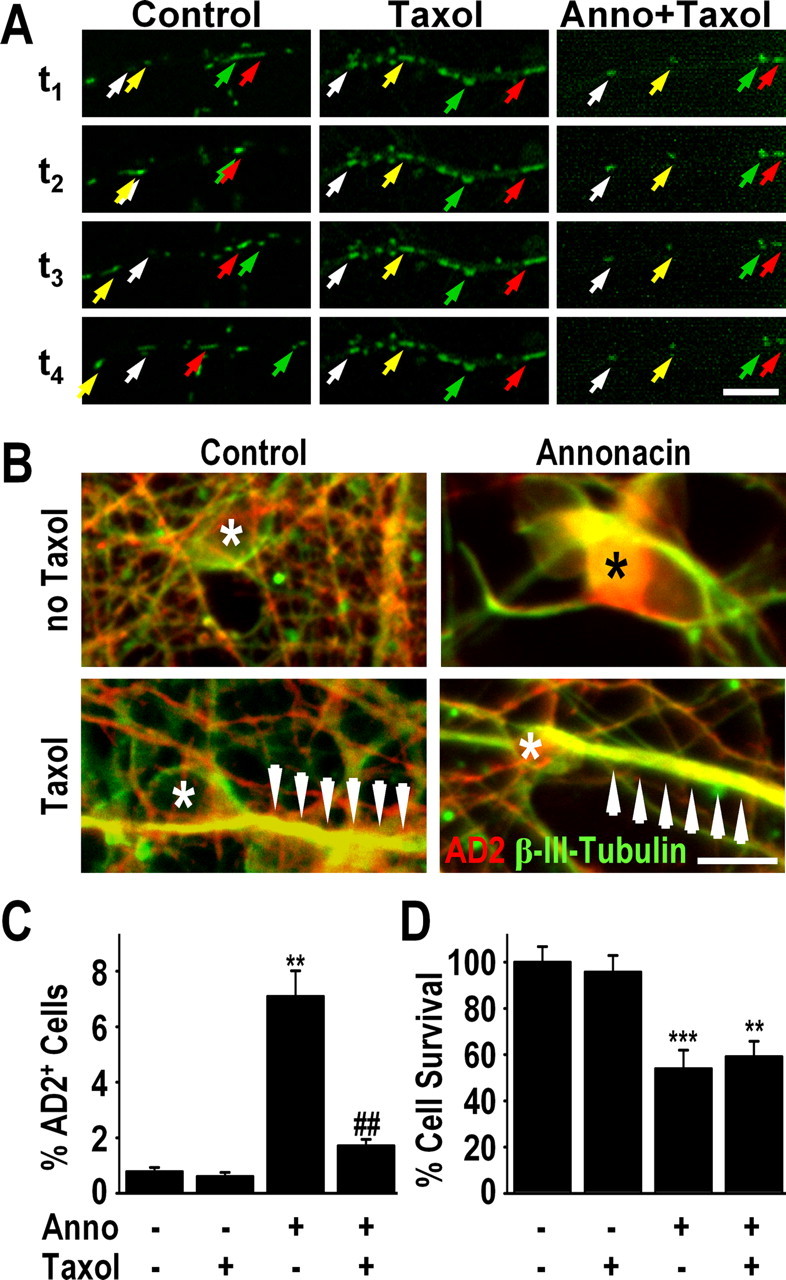
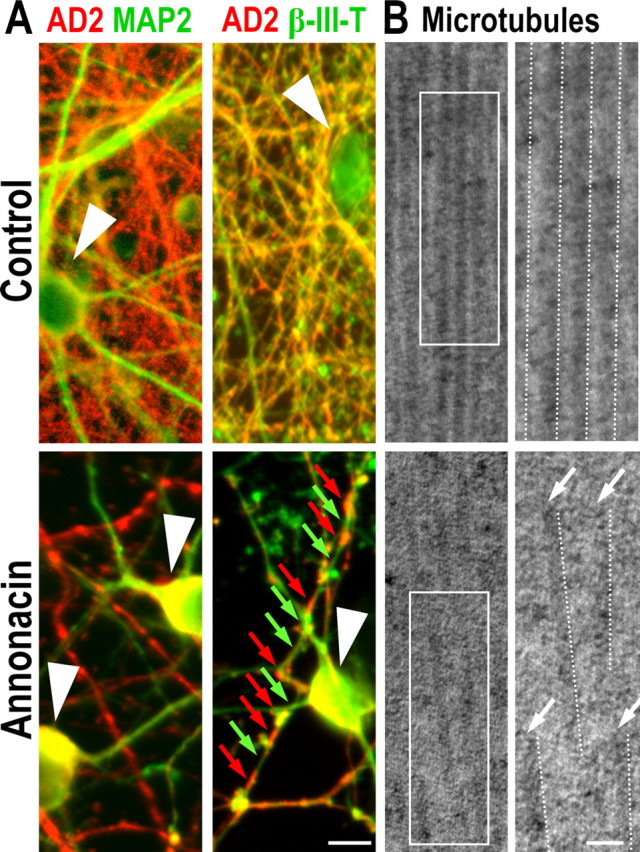
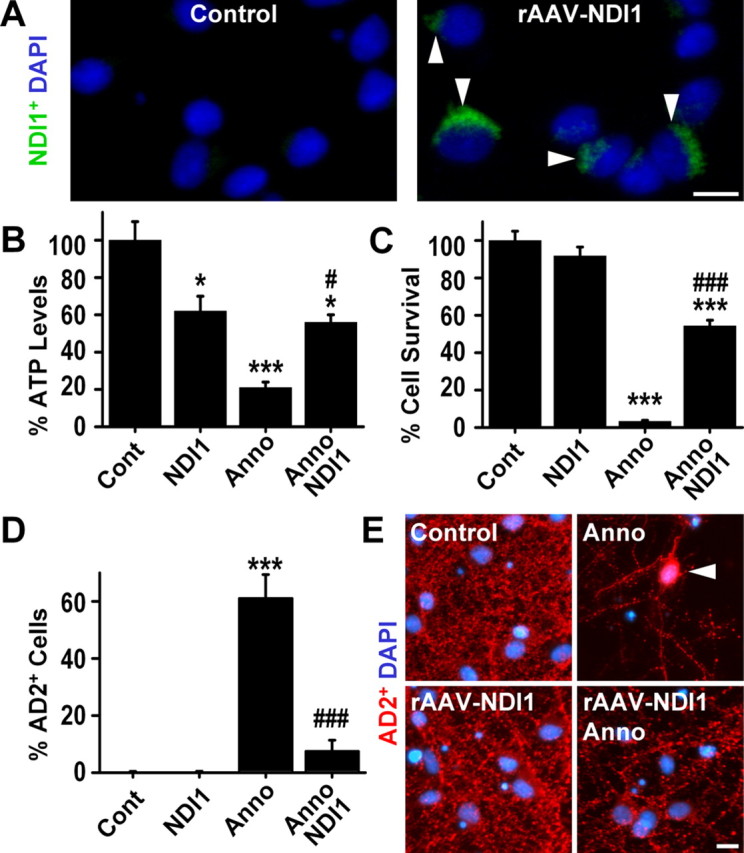
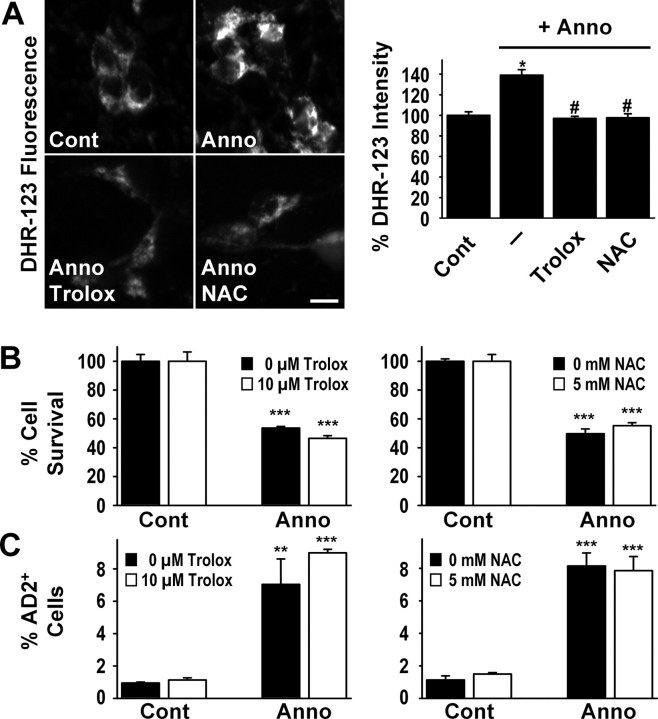
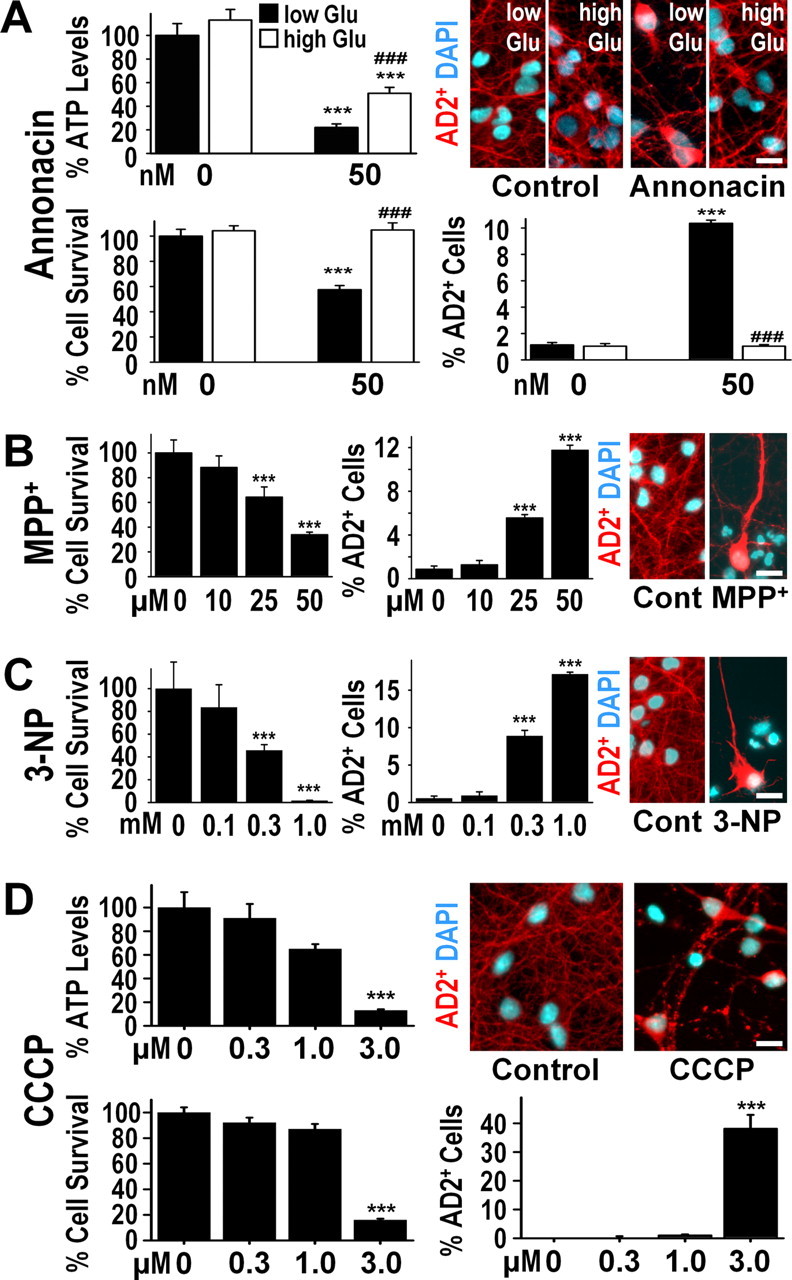
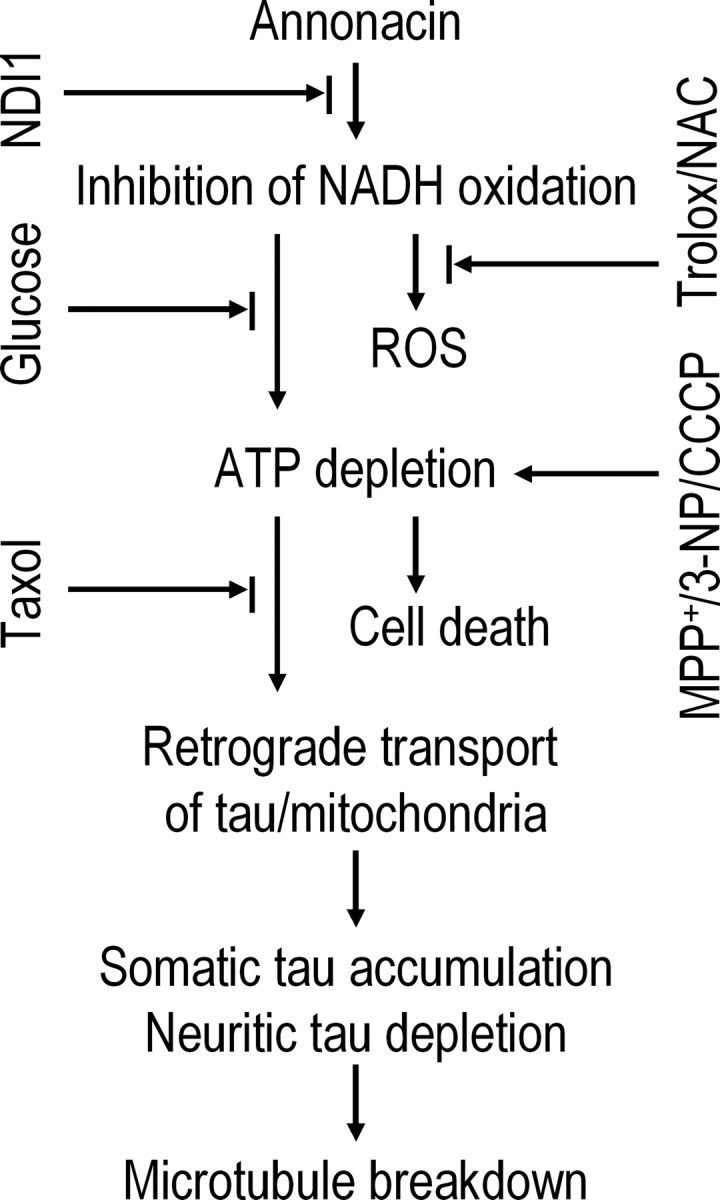
A neurodegenerative tauopathy endemic to the Caribbean island of Guadeloupe has been associated with the consumption of anonaceous plants that contain acetogenins, potent lipophilic inhibitors of complex I of the mitochondrial respiratory chain. To test the hypothesis that annonacin, a prototypical acetogenin, contributes to the etiology of the disease, we investigated whether annonacin affects the cellular distribution of the protein tau. In primary cultures of rat striatal neurons treated for 48 h with annonacin, there was a concentration-dependent decrease in ATP levels, a redistribution of tau from the axons to the cell body, and cell death. Annonacin induced the retrograde transport of mitochondria, some of which had tau attached to their outer membrane. Taxol, a drug that displaces tau from microtubules, prevented the somatic redistribution of both mitochondria and tau but not cell death. Antioxidants, which scavenged the reactive oxygen species produced by complex I inhibition, did not affect either the redistribution of tau or cell death. Both were prevented, however, by forced expression of the NDI1 nicotinamide adenine dinucleotide (NADH)-quinone-oxidoreductase of Saccharomyces cerevisiae, which can restore NADH oxidation in complex I-deficient mammalian cells and stimulation of energy production via anaerobic glycolysis. Consistently, other ATP-depleting neurotoxins (1-methyl-4-phenylpyridinium, 3-nitropropionic, and carbonyl cyanide m-chlorophenylhydrazone) reproduced the somatic redistribution of tau, whereas toxins that did not decrease ATP levels did not cause the redistribution of tau. Therefore, the annonacin-induced ATP depletion causes the retrograde transport of mitochondria to the cell soma and induces changes in the intracellular distribution of tau in a way that shares characteristics with some neurodegenerative diseases.


Figures

Figure 1.
Figure 1.
Annonacin causes a concentration-dependent cell death and redistribution of tau from the neurites to the cell body of neurons from embryonic rat striatum in culture. A, Representative photomicrographs of cultured neurons treated for 48 h with increasing concentrations of annonacin (Anno) and labeled with the antibody AD2 raised against pS396/pS404-tau (red). Nuclei are stained with 4′,6′-diamidino-2-phenylindole (DAPI; blue). Arrows show neurons with intact nuclear morphology and perinuclear AD2 immunoreactivity. B, Quantification of neuronal survival (percentage of untreated control cultures) and of neurons with AD2 immunoreactivity in the cell body (percentage of all neurons per culture well) after 48 h of annonacin treatment. ***p < 0.001 versus control. C, The redistribution of tau (arrows) in cultured neurons treated with 50 nm annonacin for 48 h is also detected by other antibodies against phosphorylated epitopes of tau: anti-AT8 raised against pS202/pT205-tau, anti-AT100 raised against pT212/pS214-tau, and anti-AT270 raised against pT181-tau (red). Nuclei are stained with DAPI (blue). Scale bars: A, C, 20 μm.
Figure 2.
Figure 2.
Biochemical and ultrastructural evidence that annonacin increases tau protein levels and induces the somatic redistribution of tau. A, Western blot analysis of cultured striatal neurons, grown under control conditions or treated for 48 h with 75 nm annonacin. The AD2 antibody labeled a single band at ∼55 kDa on 7% acrylamide gels, compatible with the fetal isoform of tau. Annonacin treatment increased the levels of AD2+ tau relative to actin. Protein extracts were prepared in standard lysis buffer (−), buffer containing phosphatase inhibitors (PI) to prevent tau dephosphorylation, or incubated with alkaline phosphatase (AP) to dephosphorylate tau. Under our experimental conditions, changes in the phosphorylation of tau could not be detected with the AD2 antibody. B, Western blot analysis of cultured striatal neurons, grown under control conditions or treated for 48 h with 50 or 100 nm annonacin. Protein extracts were prepared in lysis buffer containing phosphatase inhibitors. Both the Tau5 antibody, recognizing tau protein independently of its phosphorylation state, and the AD2 antibody labeled a single band at ∼55 kDa, which was increased compared with control conditions after treatment with 100 nm but not 50 nm annonacin. C, In a neuron under control conditions, immunogold labeling of tau by the AD2 antibody observed by electron microscopy shows abundant AD2 immunoreactivity (electron-dense black spots) in the axon (Ax) but not in the perinuclear cytoplasm (Cyt) or nucleus (Nuc; arrowhead, nucleolus). In a neuron treated with 50 nm annonacin for 48 h, AD2 immunoreactivity was sparse in the distal axon but very abundant in the perinuclear cytoplasm. As in controls, no AD2 immunoreactivity was observed in the nucleus (only in cytoplasmic invaginations into the nucleus). Immunolabeled fibrillary aggregates were not observed. Scale bar, 2 μm.
Figure 3.
Figure 3.
Annonacin causes somatic accumulation of mitochondria tagged with tau. A, Immunogold labeling of AD2+ tau visualized by electron microscopy shows an increased number of mitochondria (red stars) in the soma of a representative neuron from a culture treated for 48 h with 50 nm annonacin compared with a neuron from a control culture. Some of the mitochondria have AD2+ tau attached to their outer membranes (blue arrows). Yellow arrows indicate free AD2+ tau. Scale bar, 500 nm. B, Bright-field images of a representative control neuron and a neuron treated with 50 nm annonacin, followed by time-lapse video microscopy to show movements of mitotracker-stained mitochondria (green) in these neurons. In the control neuron, both anterograde and retrograde movements were seen. In contrast, only the retrograde movement of mitochondria from neurites to the soma was seen in the annonacin-treated neuron. Individual mitochondria are indicated in successive images with arrows of the same color. The images shown in this figure were taken at the following time points after addition of annonacin to the culture medium: t1, 1 min; t2, 10 min; t3, 50 min; t4, 80 min; t5, 140 min. The full movies are shown as supplemental data (available at www.jneurosci.org as supplemental material). Scale bar, 10 μm. C, ATP levels per milligram of protein in cultures exposed for 0, 5, 10, or 15 min to 50 nm annonacin, expressed as percentage of untreated control cultures. *p < 0.05, **p < 0.01 versus untreated controls.
Figure 4.
Figure 4.
Taxol blocks the somatic accumulation of both mitochondria and tau. A, Time-lapse video microscopy showing the movement of mitotracker-stained mitochondria (green) in neurites of a representative neuron in a control culture, a control culture treated with taxol (5 nm), and a culture treated with 50 nm annonacin (Anno) and taxol. Addition of taxol to the culture medium blocked all movement of mitochondria in both control and annonacin-treated cells. Images were taken at 10 min intervals. The first image (t1) was taken 10 min after addition of annonacin to the culture medium. Individual mitochondria are indicated in successive images with arrows of the same color. Scale bar, 10 μm. B, Immunofluorescence images showing that 50 nm annonacin, in the absence of taxol, induced the redistribution of AD2+ tau (red) from the β-III-tubulin+ axons (green) to the neuronal cell body (*). The presence of taxol (5 nm) in the culture medium prevented the annonacin-induced accumulation of AD2+ tau in the cell body. Arrows indicate neuritic hypertrophy caused by taxol-induced polymerization of β-III-tubulin. Scale bar, 20 μm. C, D, Quantification of AD2+ cell bodies (C) and neuronal survival (D) in cultures exposed for 48 h exposure to 50 nm annonacin in the absence or presence of 5 nm taxol. **p < 0.01 versus control. ##p < 0.01 annonacin plus taxol versus annonacin alone.
Figure 5.
Figure 5.
Annonacin causes fragmentation of microtubules. A, Control cultures and cultures exposed for 48 h to 50 nm annonacin, immunolabeled with antibodies against tau (AD2, red) and the dendritic marker MAP2 (green) or the axonal marker β-III-tubulin (β-III-T, green). Under control conditions, AD2+ tau is localized predominantly in axons, and its distribution is homogenous. In contrast, in annonacin-treated cultures, AD2+ tau has accumulated in the neuronal soma (white arrowheads), and the distribution of tau remaining in β-III-T+ axons is discontinuous (red arrows), leaving long stretches of the axons devoid of tau (green arrows). B, Ultrastructure of microtubules in neurons in control cultures and cultures exposed for 48 h to 50 nm annonacin. Overviews (left) and enlargements of the boxed areas (right) show that microtubules (highlighted by dotted lines) in neurites of a representative control neuron form parallel arrays and are continuous over long distances, whereas in annonacin-treated cultures, they are fragmented and disordered. Scale bar, 50 nm.
Figure 6.
Figure 6.
Annonacin-induced complex I inhibition is responsible for the somatic redistribution of tau. A, Immunohistochemistry with an antibody against yeast NDI1 shows the efficient rAAV-mediated expression of this protein (green, arrows) in transfected cells. As expected, no immunoreactivity for the yeast protein was detected in untransfected control cells. NDI1 is able to replace the NADH-oxidizing function of complex I in mammalian cells (Seo et al., 2002). DAPI (blue) stains nuclei. B–D, ATP levels (B), cell death (C), and somatic redistribution of AD2+ tau (D) in control (Cont) cultures of striatal neurons and in cultures exposed to 100 nm annonacin (Anno; 6 h for ATP, 48 h for survival and AD2), in the absence or the presence of NDI1 expression. *p < 0.05, ***p < 0.001 versus control; #p < 0.05, ###p < 0.001 versus annonacin alone. E, Photomicrographs showing that NDI1 expression prevents the annonacin-induced cell death and somatic redistribution of AD2+ tau (red, arrow) in cultured striatal neurons. DAPI (blue) stains nuclei. Scale bars: A, E, 10 μm.
Figure 7.
Figure 7.
The annonacin-induced production of ROS is not responsible for the somatic redistribution of tau. A, ROS were visualized in the cytoplasm of cultured neurons with the ROS-sensitive rhodamine derivative DHR-123, quantified by measuring the intensity of DHR-123 fluorescence in individual neurons and expressed as percentage of baseline levels in control conditions (Cont). Treatment with annonacin (Anno; 50 nm, 6 h) resulted in a significant increase in ROS production. The increase in ROS levels was completely blocked by pretreatment with the radical scavengers trolox (10 μm) and NAC (5 mm) added to the culture medium 30 min before annonacin. *p < 0.05 versus control; #p < 0.05 versus annonacin alone. Scale bar, 20 μm. B, C, Treatment with 10 μm trolox or 5 mm NAC did not prevent the loss of neurons (B) or the appearance of AD2+ tau in neuronal cell bodies (C) induced by exposure to 50 nm annonacin for 48 h. **p < 0.01, ***p < 0.001 versus controls.
Figure 8.
Figure 8.
The annonacin-induced decrease in cellular ATP levels is responsible for the somatic redistribution of tau. A, ATP levels per milligram of protein (percentage of control levels), neuronal survival (percentage of control levels), and AD2+ cell bodies (percentage of all neurons) in cultures after exposure (6 h for ATP, 48 h for survival and AD2) to 50 nm annonacin in the presence of standard low glucose (Glu) concentration (250 μm) or a high concentration of glucose (50 mm) in the culture medium. ***p < 0.001 versus controls; ###p < 0.001 annonacin high glucose versus annonacin low glucose. The photomicrographs show representative cells with AD2+ tau (red) and DAPI+ chromatin (blue) in the different experimental conditions. B, Neuronal survival and AD2+ cell bodies in culture after a 48 h exposure to different concentrations of MPP+, an inhibitor of mitochondrial complex I. C, Neuronal survival and AD2+ cell bodies in culture after a 48 h exposure to different concentrations of 3-NP, an inhibitor of mitochondrial complex II. D, ATP levels per milligram of protein, neuronal survival, and AD2+ cell bodies in cultures after exposure (6 h for ATP, 48 h for survival and AD2) to different concentrations of CCCP, an uncoupler of oxidative phosphorylation. Scale bars, 20 μm.
Figure 9.
Figure 9.
The sequence of pathological events induced by annonacin in primary cultures of striatal neurons. Annonacin inhibited the NADH-quinone-oxidoreductase activity of mitochondrial complex I, leading to increased ROS and decreased ATP production. The latter appears to be responsible for the retrograde transport of tau from neurites to the cell soma and, consequently, microtubule breakdown, because the antioxidants trolox and NAC had no effect on cell death or the distribution of tau, whereas increasing ATP levels by the expression of the yeast NADH oxidase NDI1 or the stimulation of anaerobic glycolysis with high glucose concentrations prevented both cell death and the redistribution of tau. ATP depletion induced by the respiratory chain inhibitors MPP+ and 3-NP or by the mitochondrial uncoupler CCCP mimicked annonacin-induced cell death and redistribution of tau. Taxol prevented the redistribution of tau and mitochondria but not the cell death induced by annonacin, suggesting that, in this experimental model, the redistribution of tau to the cell body is not involved in either neuroprotective or neurodegenerative pathways. It may rather be considered to be a stigma characteristic of neuronal death induced by energy failure.

Similar articles

Cited by

References

    1. Albers DS, Swerdlow RH, Manfredi G, Gajewski C, Yang L, Parker WD, Jr, Beal MF. Further evidence for mitochondrial dysfunction in progressive supranuclear palsy. Exp Neurol. 2001;168:196–198. - PubMed
    1. Angibaud G, Gaultier C, Rascol O. Atypical parkinsonism and Annonaceae consumption in New Caledonia. Mov Disord. 2004;19:603–604. - PubMed
    1. Arriagada PV, Growdon JH, Hedley-White ET, Hyman BT. Neurofibrillary tangles but not senile plaques parallel duration and severity of Alzheimer's disease. Neurology. 1992;82:239–259. - PubMed
    1. Bai Y, Hajek P, Chomyn A, Chan E, Seo BB, Matsuno-Yagi A, Yagi T, Attardi G. Lack of complex I activity in human cells carrying a mutation in MtDNA-encoded ND4 subunit is corrected by the Saccharomyces cerevisiae NADH-quinone oxidoreductase (NDI1) gene. J Biol Chem. 2001;276:38808–38813. - PubMed
    1. Bancher C, Brunner C, Lassmann H, Budka H, Jellinger K, Wiche G, Seitelberger F, Grundke-Iqbal I, Iqbal K, Wisniewski HM. Accumulation of abnormally phosphorylated tau precedes the formation of neurofibrillary tangles in Alzheimer's disease. Brain Res. 1989;477:90–99. - PubMed

Publication types

MeSH terms

LinkOut - more resources