. 2007 Sep;293(3):F938-45.
doi: 10.1152/ajprenal.00146.2007. Epub 2007 Jul 18.

Kidney-specific enhancement of ANG II stimulates endogenous intrarenal angiotensinogen in gene-targeted mice

Affiliations

Kidney-specific enhancement of ANG II stimulates endogenous intrarenal angiotensinogen in gene-targeted mice

Hiroyuki Kobori et al. Am J Physiol Renal Physiol. 2007 Sep.

Abstract

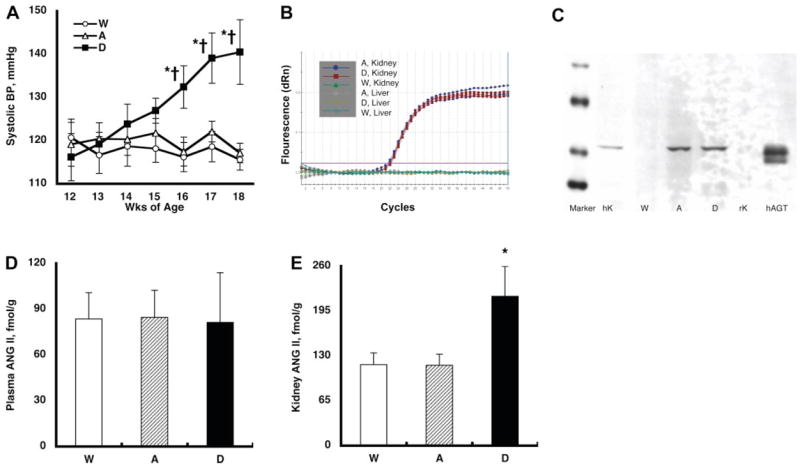
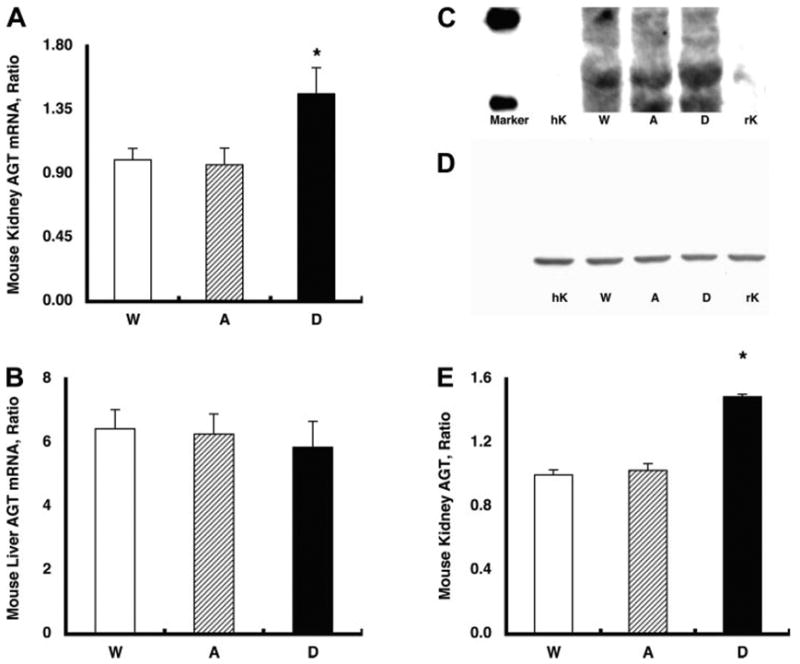
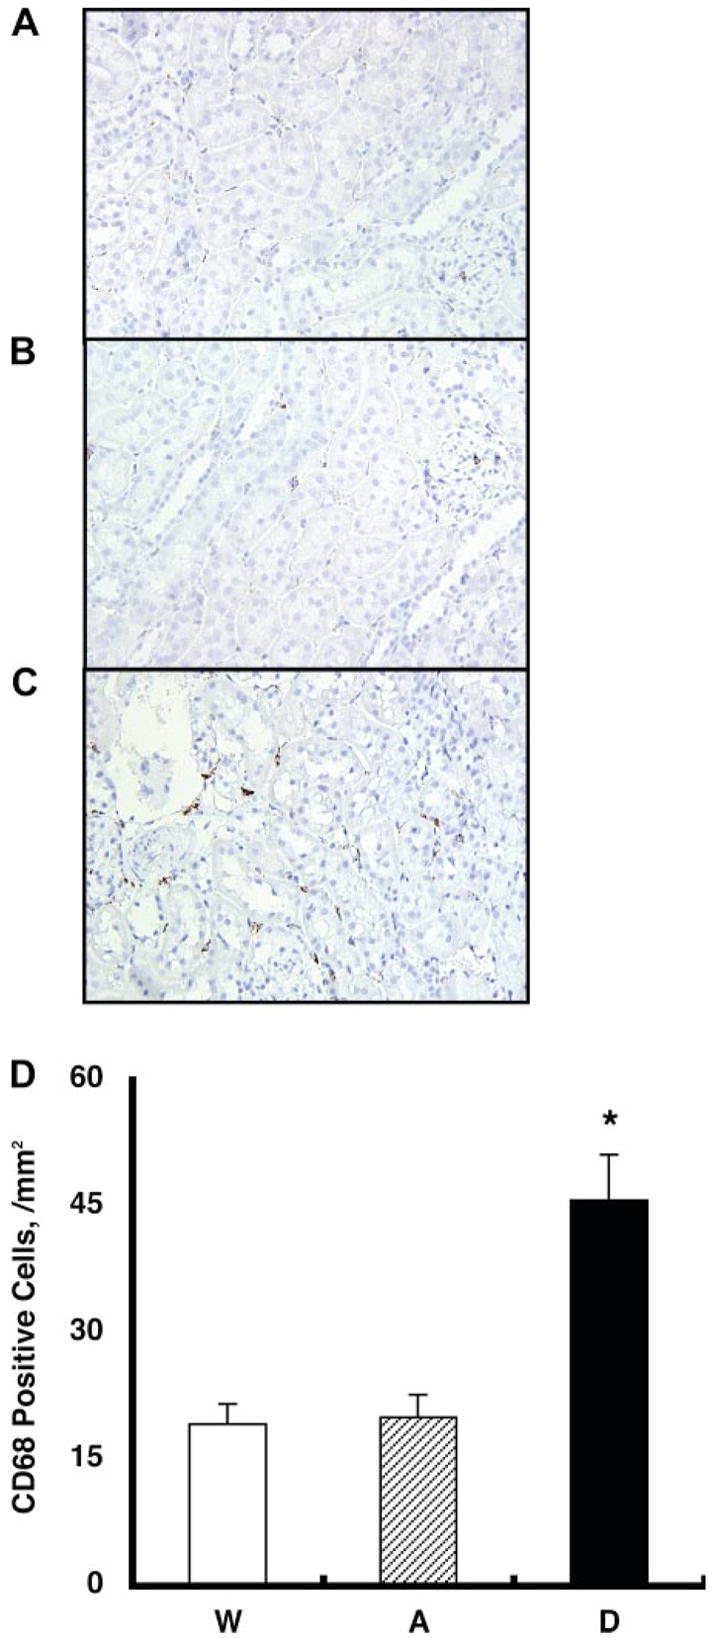
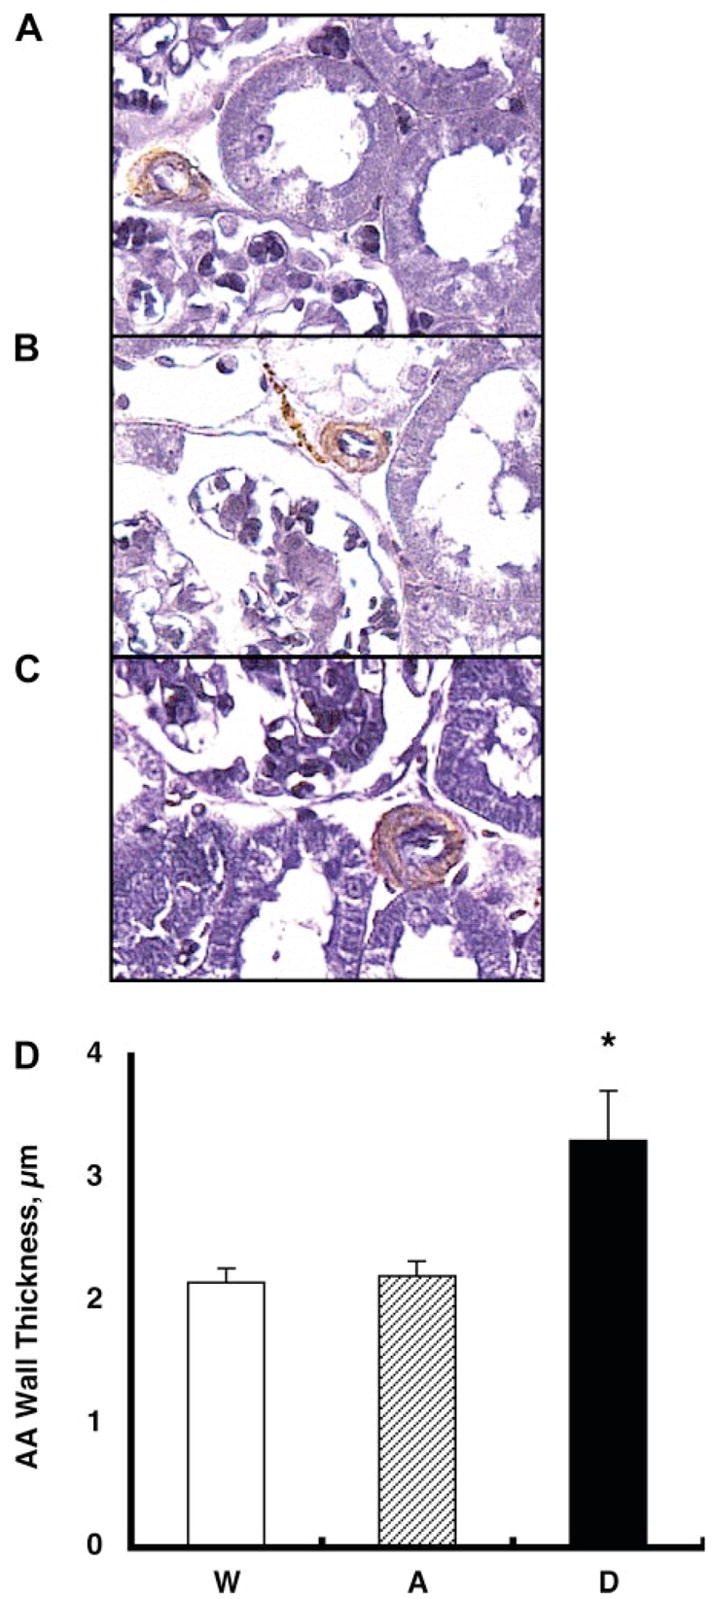
This study was performed in transgenic mice to test the hypothesis that the selective intrarenal overproduction of ANG II increases intrarenal mouse (m) angiotensinogen (AGT) expression. We used the following three groups: 1) single transgenic mice (group A, n = 14) expressing human (h) AGT only in the kidney, 2) double-transgenic mice (group D, n = 13) expressing human renin systemically in addition to hAGT only in the kidney, and 3) wild-type (group W, n = 12) mice. Exogenous hAGT protein is inactive in group A because endogenous mouse renin cannot cleave hAGT to ANG I because of a high species specificity. All mice were monitored from 12 to 18 wk of age. Systolic blood pressure progressively increased from 116 +/- 5 mmHg (12 wk) to 140 +/- 7 (18 wk) in group D. This increase was not observed in groups A or W. Intrarenal hAGT levels were similar in groups A and D; however, hAGT was not detectable in kidneys of group W. Kidney ANG II levels were increased in group D (216 +/- 43 fmol/g) compared with groups A (117 +/- 16) and W (118 +/- 17). However, plasma ANG II concentrations were similar among the three groups. Endogenous renal mAGT mRNA was increased significantly in group D (1.46 +/- 0.19, ratio) compared with groups A (0.97 +/- 0.12) and W (1.00 +/- 0.08). Endogenous renal mAGT protein was also significantly increased in group D compared with groups A and W. Interstitial collagen-positive area, interstitial macrophage/monocyte infiltration, and afferent arteriolar wall thickness were increased significantly in group D compared with groups A and W. These data indicate for the first time that the selective stimulation of intrarenal production of ANG II from hAGT augments endogenous intrarenal mAGT mRNA and protein expression.


Figures

Fig. 1
Fig. 1
A: temporal profile of systolic blood pressure (BP). Systolic BP was similar at 12 wk of age among the three groups. However, systolic BP progressively increased from 116 ± 5(12 wk) to 140 ± 7 (18 wk) mmHg in double-transgenic mice (group D) expressing human renin (hR) systemically in addition to human (h) angiotensinogen (AGT) only in the kidney during this period. This increase was not observed in single-transgenic mice (group A, 117 ± 2 at 18 wk) expressing hAGT only in the kidney or wild type mice (group W, 116 ± 2 at 18 wk). P < 0.05 compared with the corresponding group W mice at that time period (*) and compared with the corresponding group at 12 wk of age (†). B: representative amplification plot of the real-time RT-PCR for exogenous hAGT mRNA. Kidney RNA samples from group A and group D mice demonstrated a nice and equivalent amplification. Kidney RNA samples from group W mice did not show any amplification. Moreover, liver samples from either group A, group D, or group W mice did not exhibit any amplification. These data clearly indicate that the exogenous hAGT mRNA were expressed only in the kidneys of group A and D mice. C: representative Western blot analysis for exogenous hAGT protein. The developed antibody specific for hAGT recognized AGT in human kidney (hK, 10 μg of protein) and plasma (50 ng; Calbiochem) but not in rat kidney (rK, 10 μg of protein). With the use of this human-specific AGT antibody, kidney protein samples (10 μg of protein) from group A, D, and W mice were evaluated. This human-specific AGT antibody demonstrated AGT protein in group A and D mice but not in group W mice. These data clearly indicate that the exogenous hAGT protein was expressed only in the kidneys of group A and D mice. D: plasma ANG II concentrations. Plasma ANG II levels were similar among the 3 groups. E: kidney ANG II contents. Kidney ANG II levels were increased significantly in group D mice (216 ± 43 fmol/g) compared with group A (117 ± 16) and group W (118 ± 17) mice. *P < 0.05 compared with the group W mice.
Fig. 2
Fig. 2
A: endogenous mouse (m) AGT mRNA levels in the kidney. Endogenous mAGT mRNA levels in the kidney were increased significantly in group D mice (1.46 ± 0.19, relative ratio) compared with group A (0.97 ± 0.12) and group W (1.00 ± 0.08) mice. *P < 0.05 compared with the group W mice. B: endogenous mAGT mRNA levels in the liver. The augmented endogenous mAGT levels were limited in the kidney because endogenous mAGT mRNA levels in the liver were not altered among the three groups. C: representative Western blot analysis for endogenous mAGT protein. The developed antibody specific for rodent AGT recognized AGT in mouse kidney (10 μg of protein) and rat kidney (10 μg of protein) but not in human kidney (10 μg of protein). With the use of this rodent-specific AGT antibody, kidney protein samples from group A, D, and W mice were evaluated. D: representative Western blot analysis for β-actin protein showing that β-actin protein levels were similar among the groups. E: densitometric analysis demonstrated that endogenous mAGT protein in the kidney was also increased significantly in group D (1.49 ± 0.02, relative ratio) compared with group A (1.03 ± 0.04) and group W (1.00 ± 0.03) mice. *P < 0.05 compared with the group W mice.
Fig. 3
Fig. 3
Interstitial macrophage/monocyte infiltration was evaluated by CD68-positive cell number, which is a surface marker for macrophages and monocytes, using zinc-saturated formalin-fixed paraffin-embedded kidney samples from group W (A), group A (B), and group D (C) mice. CD68-positive cells are stained in brown. D: CD68-positive cell numbers were increased significantly in group D mice (46 ± 5 cells/mm2) compared with group A (20 ± 3) and group W (19 ± 2) mice. *P < 0.05 compared with the group W mice.
Fig. 4
Fig. 4
The thickness of afferent arteriolar (AA) wall was visualized by immunohistochemistry of α-smooth muscle isoform of actin and elastin stain using zinc-saturated formalin-fixed paraffin-embedded kidney samples from group W (A), group A (B), and group D (C) mice. Afferent arteriolar walls are stained in brown and purple. D: the thickness of afferent arteriolar wall was increased significantly in group D mice (3.31 ± 0.41 μm) compared with group A (2.21 ± 0.12) and group W (2.16 ± 0.11) mice. *P < 0.05 compared with group W mice.

References

    1. Baltatu O, Silva JA, Jr, Ganten D, Bader M. The brain renin-angiotensin system modulates angiotensin II-induced hypertension and cardiac hypertrophy. Hypertension. 2000;35:409–412. - PubMed
    1. Carey AV, Carey RM, Gomez RA. Expression of alpha-smooth muscle actin in the developing kidney vasculature. Hypertension. 1992;19:II168–II175. - PubMed
    1. Casarini DE, Boim MA, Stella RC, Krieger-Azzolini MH, Krieger JE, Schor N. Angiotensin I-converting enzyme activity in tubular fluid along the rat nephron. Am J Physiol Renal Physiol. 1997;272:F405–F409. - PubMed
    1. Crowley SD, Gurley SB, Herrera MJ, Ruiz P, Griffiths R, Kumar AP, Kim HS, Smithies O, Le TH, Coffman TM. Angiotensin II causes hypertension and cardiac hypertrophy through its receptors in the kidney. Proc Natl Acad Sci USA. 2006;103:17985–17990. - PMC - PubMed
    1. Danser AH, Admiraal PJ, Derkx FH, Schalekamp MA. Angiotensin I-to-II conversion in the human renal vascular bed. J Hypertens. 1998;16:2051–2056. - PubMed

Publication types

LinkOut - more resources