Ex vivo monitoring of antigen-specific CD4+ T cells after recall immunization with tetanus toxoid
- PMID: 17634505
- PMCID: PMC2043311
- DOI: 10.1128/CVI.00004-07
Ex vivo monitoring of antigen-specific CD4+ T cells after recall immunization with tetanus toxoid
Abstract
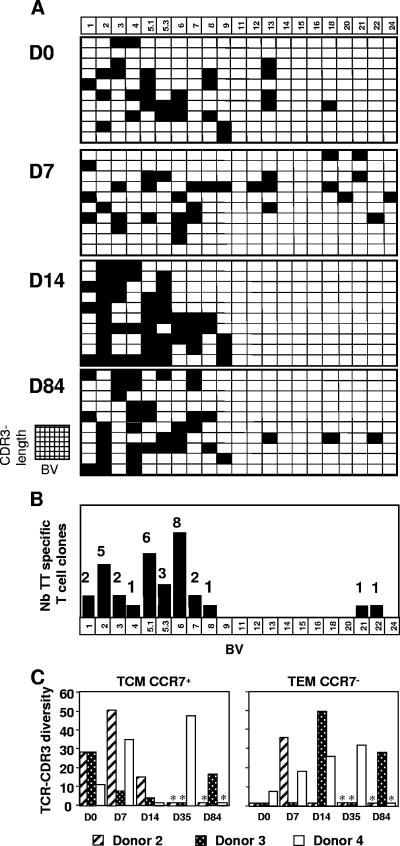
To monitor antigen-specific CD4+ T cells during a recall immune response to tetanus toxoid (TT), a sequential analysis including ex vivo phenotyping and cytokine flow cytometry, followed by cloning and T-cell-receptor (TCR) spectratyping of cytokine-positive CD4+ T cells, was performed. Grossly, twice as many TT-specific CD4+ T-cell clones, ex vivo derived from the CCR7+/- CD69+ interleukin-2-positive (IL-2+) CD4+ subsets, belonged to the central memory (T(CM); CD62L+ CD27+ CCR7+) compared to the effector memory population (T(EM); CD62L- CD27- CCR7-). After the boost, a predominant expansion of the T(CM) population was observed with more limited variations of the T(EM) population. TCR beta-chain-variable region (BV) spectratyping and sequencing confirmed a large concordance between most frequently expressed BV TCR-CDR3 from ex vivo-sorted CCR7+/- CD69+ IL-2+ CD4+ subsets and BV usage of in vitro-derived TT-specific CD4+ T-cell clones, further demonstrating the highly polyclonal but stable character of the specific recall response to TT. Taken together, ex vivo flow cytometry analysis focused on the CCR7+/- CD69+ IL-2+ CD4+ subsets appears to target the bulk of antigen-specific T cells and to reach an analytical power sufficient to adequately delineate in field trials the profile of the antigen-specific response to vaccine.
Figures


Similar articles
-
CD4 T-helper cell cytokine phenotypes and antibody response following tetanus toxoid booster immunization.J Immunol Methods. 2013 Apr 30;390(1-2):18-29. doi: 10.1016/j.jim.2013.01.001. Epub 2013 Jan 11. J Immunol Methods. 2013. PMID: 23318779
-
Functional and phenotypic characterization of tetanus toxoid-specific human CD4+ T cells following re-immunization.Eur J Immunol. 2007 Apr;37(4):1129-38. doi: 10.1002/eji.200636885. Eur J Immunol. 2007. PMID: 17372991
-
Bystander stimulation of activated CD4+ T cells of unrelated specificity following a booster vaccination with tetanus toxoid.Eur J Immunol. 2010 Apr;40(4):976-85. doi: 10.1002/eji.200940017. Eur J Immunol. 2010. PMID: 20104490
-
Antigen-induced death of mature T lymphocytes: analysis by flow cytometry.Immunol Rev. 1994 Dec;142:157-74. doi: 10.1111/j.1600-065x.1994.tb00888.x. Immunol Rev. 1994. PMID: 7698793 Review. No abstract available.
-
TCR signal quantity and quality in CD4+ T cell differentiation.Trends Immunol. 2014 Dec;35(12):591-596. doi: 10.1016/j.it.2014.09.008. Epub 2014 Oct 22. Trends Immunol. 2014. PMID: 25457838 Free PMC article. Review.
Cited by
-
Immune Tolerance-Adjusted Personalized Immunogenicity Prediction for Pompe Disease.Front Immunol. 2021 Jun 16;12:636731. doi: 10.3389/fimmu.2021.636731. eCollection 2021. Front Immunol. 2021. PMID: 34220802 Free PMC article. Clinical Trial.
-
Comparing [3H] thymidine LPT and CFSE assay to assess lymphocyte proliferation in beryllium-exposed sarcoidosis patients.Heliyon. 2023 Aug 18;9(9):e19242. doi: 10.1016/j.heliyon.2023.e19242. eCollection 2023 Sep. Heliyon. 2023. PMID: 37662805 Free PMC article.
-
A guide to measuring phagosomal dynamics.FEBS J. 2021 Mar;288(5):1412-1433. doi: 10.1111/febs.15506. Epub 2020 Aug 16. FEBS J. 2021. PMID: 32757358 Free PMC article. Review.
-
Rabies vaccination induces a CD4+ TEM and CD4+CD8+ TEMRA TH1 phenotype in dogs.PLoS One. 2025 May 12;20(5):e0323823. doi: 10.1371/journal.pone.0323823. eCollection 2025. PLoS One. 2025. PMID: 40354406 Free PMC article.
-
Generation of frameshift-mutated TGFβR2-specific T cells in healthy subjects following administration with cancer vaccine candidate FMPV-1/GM-CSF in a phase 1 study.Cancer Immunol Immunother. 2025 Feb 25;74(4):115. doi: 10.1007/s00262-025-03969-6. Cancer Immunol Immunother. 2025. PMID: 39998682 Free PMC article. Clinical Trial.
References
-
- Ahmadzadeh, M., S. F. Hussain, and D. L. Farber. 2001. Heterogeneity of the memory CD4 T-cell response: persisting effectors and resting memory T cells. J. Immunol. 166926-935. - PubMed
-
- Anderson, R. J., C. M. Hannan, S. C. Gilbert, S. M. Laidlaw, E. G. Sheu, S. Korten, R. Sinden, G. A. Butcher, M. A. Skinner, and A. V. Hill. 2004. Enhanced CD8+ T-cell immune responses and protection elicited against Plasmodium berghei malaria by prime boost immunization regimens using a novel attenuated fowlpox virus. J. Immunol. 1723094-3100. - PubMed
-
- Barbey, C., J.-M. Tiercy, N. Fairweather, H. Niemann, R. Seger, and G. Corradin. 1994. Processing and presentation of tetanus toxin by antigen-presenting cells from patients with chronic granulomatous disease to human specific T-cell clones is not impaired. Clin. Exp. Immunol. 95227-231. - PMC - PubMed
-
- Barbey, C., C. Watts, and G. Corradin. 1995. Antigen-processing organelles from DRB1*1101 and DRB1*1104 B-cell lines display a differential degradation activity. Eur. J. Immunol. 2530-36. - PubMed
-
- Bejon, P., J. Mwacharo, O. Kai, T. Mwangi, P. Milligan, S. Todryk, S. Keating, T. Lang, B. Lowe, C. Gikonyo, C. Molyneux, G. Fegan, S. C. Gilbert, N. Peshu, K. Marsh, and A. V. Hill. 2006. A phase 2b randomised trial of the candidate malaria vaccines FP9 ME-TRAP and MVA ME-TRAP among children in Kenya. PLoS Clin. Trials 1e29. - PMC - PubMed
Publication types
MeSH terms
Substances
LinkOut - more resources
Full Text Sources
Other Literature Sources
Research Materials