. 2007 Aug;65(3):761-79.
doi: 10.1111/j.1365-2958.2007.05824.x.

The cAMP pathway is important for controlling the morphological switch to the pathogenic yeast form of Paracoccidioides brasiliensis

Affiliations

The cAMP pathway is important for controlling the morphological switch to the pathogenic yeast form of Paracoccidioides brasiliensis

Daliang Chen et al. Mol Microbiol. 2007 Aug.

Abstract

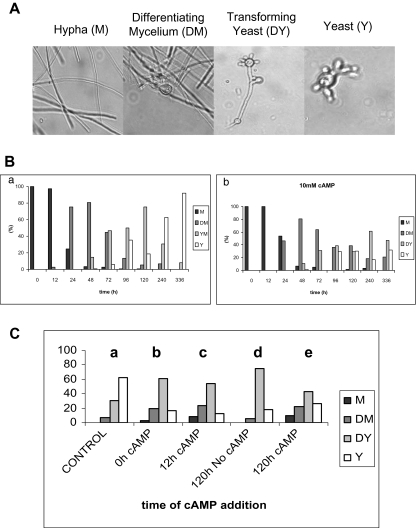
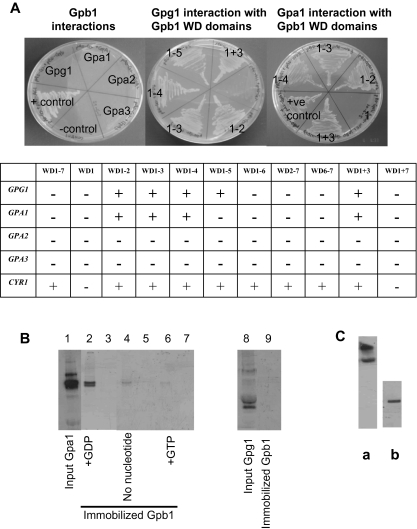
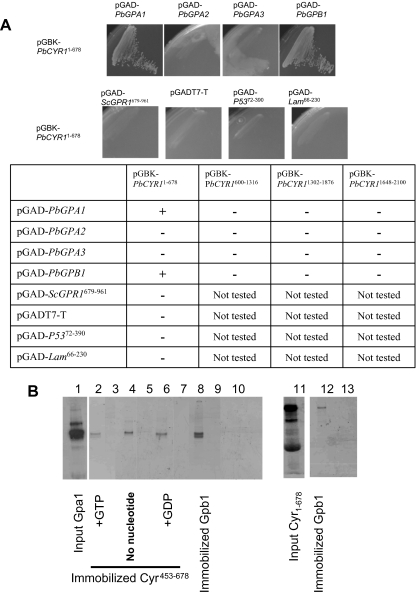
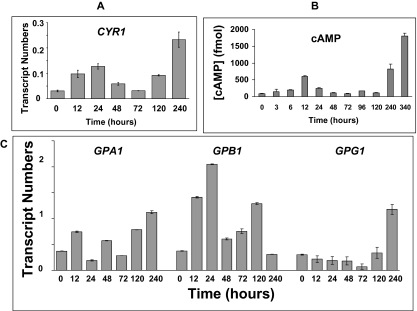
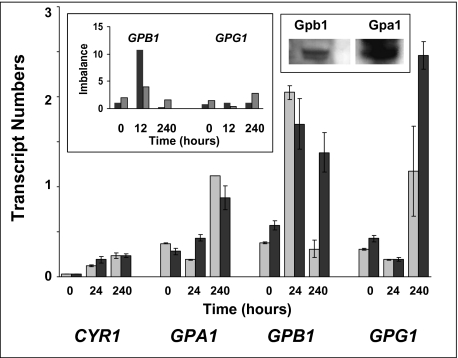
Paracoccidioides brasiliensis is a human pathogenic fungus that switches from a saprobic mycelium to a pathogenic yeast. Consistent with the morphological transition being regulated by the cAMP-signalling pathway, there is an increase in cellular cAMP levels both transiently at the onset (< 24 h) and progressively in the later stages (> 120 h) of the transition to the yeast form, and this transition can be modulated by exogenous cAMP. We have cloned the cyr1 gene encoding adenylate cyclase (AC) and established that its transcript levels correlate with cAMP levels. In addition, we have cloned the genes encoding three Galpha (Gpa1-3), Gbeta (Gpb1) and Ggamma (Gpg1) G proteins. Gpa1 and Gpb1 interact with one another and the N-terminus of AC, but neither Gpa2 nor Gpa3 interacted with Gpb1 or AC. The interaction of Gpa1 with Gpb1 was blocked by GTP, but its interaction with AC was independent of bound nucleotide. The transcript levels for gpa1, gpb1 and gpg1 were similar in mycelium, but there was a transient excess of gpb1 during the transition, and an excess of gpa1 in yeast. We have interpreted our findings in terms of a novel signalling mechanism in which the activity of AC is differentially modulated by Gpa1 and Gpb1 to maintain the signal over the 10 days needed for the morphological switch.


Figures

Fig. 1
Fig. 1. The cAMP-signalling pathway regulates the transition from mycelium to yeast in P. brasiliensis
A. The morphology of P. brasiliensis cells, growing in liquid culture, which had been induced to undergo the mycelium-to-yeast transition by increasing the temperature from 26°C to 37°C and was monitored to quantify the different morphotypes that are produced during this process. Cellular forms were classified into four different morphological states: (i) hyphae; (ii) differentiating hyphae, characterized by the development of chlamydospore-like cells, produced by intercalary or lateral swellings in the fertile hyphae; (iii) transforming yeast, characterized by the production of multiple buds by the chlamydospore; and (iv) mature, multibudding yeast. At the indicated times during the morphological switch, 300 morphological units were picked and the number of individual forms quantified. B. The bar charts show the percentage of each morphological form at increasing times during the morphological transition from mycelium to yeast in the absence (a) and presence (b) of 10 mM dibutyryl-cAMP. The data indicate that exogenous dibutyryl-cAMP retards the mycelium-to-yeast morphological transition. C. The bar charts show the percentage of each morphological form at 240 h after initiating the transition in the absence of cAMP (chart a) and for cells to which 10 mM dibutyryl-cAMP was added at the start of the transition (chart b), at 12 h (chart c) and 120 h (chart e) after initiating the transition; for comparison, the percentage of each morphological forms after 120 h is also shown (chart d). The data indicate that the addition of exogenous dibutyryl-cAMP late in the transition reverses the mycelium-to-yeast morphological transition. M-mycelium; DM-Differentiating mycelium; DY-Differentiating yeast; Y-Yeast.
Fig. 2
Fig. 2
A. GPA1, but not GPA2 nor GPA3, and GPG1 interact with GPB1. Each of the P. brasiliensis proteins Gpa1, Gpa2, Gpa3, Gpg1 and Cyr1 was tested by two-hybrid screening in S. cerevisiae for interactions with Gpb1 (e.g. WD1–7) and a series of truncates in which successive WD domains were deleted from the C-terminus (e.g. WD1–6 to WD1); a construct that lacked the N-terminal WD domain (e.g. WD2–7); a construct that comprised the two C-terminal WD domains (e.g. WD6–7); and a fusion of WD domains 1 and 3 (e.g. WD1+3), and 1 and 7 (e.g. WD1+7). S. cerevisiae strain AH109, harbouring pGADT7 plasmids bearing genes that encoded proteins to test for interactions with Gpb1 and truncates of this protein, expressed from pGBKT7, were identified by auxotrophic selection on SD/–Leu/–Trp/–His/–ADE plates and Xgal assays. As illustrated by the left-hand plate, full-length Gpb1 did not interact with Gpa1, Gpa2, Gpa3 nor Gpg1. However, full-length Gpb1 did interact with the positive control Cyr1−678, consequently, establishing that the full-length protein is expressed. The middle- and right-hand plates show the interaction of Gpg1 and Gpa1 respectively with the WD domains of Gpb1. As a negative control, each pGBK protein vector was cotransformed, with pGADT7, into AH109 and screen for growth on SD/–Leu/–Trp/–His/–ADE plates. None of these control cells grew (data not shown). In the accompanying table, the (+) and (–) symbols are indicative of the presence and absence of protein–protein interactions respectively. B. Pull-down assays to demonstrate that Gpa1 interacts with Gpb1. GST and GST-Gpb1 were purified from bacteria, loaded onto glutathione sepharose beads before incubation with in vitro translated 35S-Gpa1and 10 mM nucleotide. After washing the beads, the proteins were eluted by the addition of 4× NuPAGE LDS sample buffer, followed by boiling at 90°C for 5 min, and separated on a 4–12% NuPAGE gel under denaturing conditions. Bound Gpa1 was detected as a gel band by autoradiography. Lanes 2, 4 and 6 establish that Gpa1 binds to immobilized Gpb1, but the apparent affinity decreases in order of incubation with GDP (lane 2), no nucleotide (lane 4) and GTP (lane 6). Negative controls, using immobilized GST, are shown in lanes 3, 5, 7 and 10. Using in vitro translated 35S-Gpg1 (lane 8), there was no detectable interaction with Gpb1 (lane 9). C. Gpb1 and Gpa1 used in pull-down assays cross-react with specific antibodies. (a) Gpb1 produced as a fusion protein with GST in E. coli and (b) Gpa1 synthesized using an in vitro transcription/translation system ran at the expected Mr on SDS-PAGE gels and cross-reacted with antibodies generated to specific sequences within these proteins.
Fig. 3
Fig. 3
A. Yeast two-hybrid assays indicate that full-length GPA1 and GPB1, but not GPA2 nor GPA3, directly interact with CYR11−678. Bait and prey vectors were simultaneously transformed into yeast strain AH109 and plated out on SD/–Leu/–Trp for 3 days. Yeast colonies that grew on SD/–Leu/Trp were restreaked on SD/–Ade/–His/–Leu/–Trp and incubated for a further 3 days. The results growths indicate that pGAD-PbGPA1 and pGAD-PbGPB1 could, but pGAD-PbGPA2 and pGAD-PbGPA3 could not, directly interact with pGBK-PbCYR11−678. In a series of negative controls, pGBK-PbCYR11−678 could not interact with pGAD-ScGPR1679−961, pGADT7-T, pGAD-P5372−390 and pGAD-Lam66−230. B. Pull-down assays to demonstrate that Gpa1 and Gpb1 both interact with Gpb1. GST and GST-Cyr453−678 were purified from bacteria, loaded onto glutathione sepharose beads before incubation with in vitro translated 35S-Gpa1 and 10 mM nucleotide. After washing the beads, the proteins were eluted by the addition of 4× NuPAGE LDS sample buffer, followed by boiling at 90°C for 5 min, and separated on a 4–12% NuPAGE gel under denaturing conditions. Bound Gpa1 was detected as a gel band by autoradiography. Lanes 2, 4 and 6 establish that Gpa1 binds to immobilized Cyr1, but there was little difference in apparent affinity after incubation with GTP (lane 2), no nucleotide (lane 4) or GDP (lane 6). Negative controls, using immobilized GST, are shown in lanes 3, 5, 7, 10 and 13. A control using immobilized GST-Gpb1 to pull-down 35S-Gpa1, in the presence of 10 mM GDP, shows a more intense band, suggesting that Gpa1-GDP is bound with higher affinity to Gpb1 than to Cyr. Using in vitro translated 35S-Cyr1−678 (lane 11), an interaction with immobilized GST-Gpb1 (lane 12) was detected.
Fig. 4
Fig. 4
The changes in intracellular cAMP levels correlate with the CYR1, GPA1, GPB1 and GPG1 transcript levels during the mycelium-to-yeast transition. The measured quantity of each P. brasiliensis gene mRNA in each of the treated samples was normalized by using the CT values obtained for the α-tubulin RNA amplifications run on the same plate. The relative quantification of each P. brasiliensis gene and α-tubulin gene expression was determined by a standard curve (i.e. Ct values plotted against the logarithm of the DNA copy number). The values represent the number of copies of the cDNAs of each P. brasiliensis gene divided by the number of copies of the cDNAs of the α-tubulin gene. A. A bar chart showing the CYR1 transcript levels at the indicated times following an increase in temperature from 26°C to 37°C to induce the mycelium-to-yeast transformation. The data represent the average of three independent measurements. B. The corresponding changes in the cellular cAMP levels during the morphological transition from mycelium to yeast are shown in chart B. Intracellular cAMP measurements were made using a non-acetylated EIA procedure (see Experimental procedures) and are the average of six assays. C. A bar chart showing the GPA1, GPB1 and GPG1 transcript levels at the indicated times following an increase in temperature from 26°C to 37°C to induce the mycelium-to-yeast transformation. The data represent the average of three independent measurements.
Fig. 5
Fig. 5
The hindrance of the mycelium-to-yeast transition by dibutyryl-cAMP correlates with an imbalance in Gpa1 and Gpb1 expression. A set of bar charts for the transcript levels of the CYR1, GPA1, GPB1 and GPG1 genes at the indicated times following an increase in temperature from 26°C to 37°C to induce the mycelium-to-yeast transformation in the absence (black bars) and presence (grey bars) of 10 mM dibutyryl-cAMP. The right inset shows the ratio of the GPB1 and GPG1 transcripts respectively relative to the number of GPA1 transcripts in mycelium, and at 12 and 240 h after the onset of the transition to the yeast form. The transcript numbers were determined in the absence (black bars) and presence (grey bars) of 10 mM dibutyryl-cAMP. Data are the average of three independent measurements. The right inset is a Western blot showing that Gpa1 is expressed at a higher level than Gpb1 in yeast.

Similar articles

Cited by

References

    1. Alspaugh JA, Pukkila-Worley R, Harashima T, Cavallo LM, Funnell D, Cox GM, et al. Adenylyl cyclase functions downstream of the Galpha protein Gpa1 and controls mating and pathogenicity of Cryptococcus neoformans. Eukaryot Cell. 2002;1:75–84. - PMC - PubMed
    1. Bansal PK, Abdulle R, Kitagawa K. Sgt1 associates with Hsp90: an initial step of assembly of the core kinetochore complex. Mol Cell Biol. 2004;24:8069–8079. - PMC - PubMed
    1. Batlle M, Lu A, Green DA, Xue Y, Hirsch JP. Krh1p and Krh2p act downstream of the Gpa2p G (alpha) subunit to negatively regulate haploid invasive growth. J Cell Sci. 2003;116:701–710. - PubMed
    1. Bennett RJ, Johnson AD. The role of nutrient regulation and the Gpa2 protein in the mating pheromone response of C. albicans. Mol Microbiol. 2006;62:100–119. - PubMed
    1. Borges-Walmsley MI, Walmsley AR. cAMP signaling in pathogenic fungi: control of dimorphic switching and pathogenicity. Trends Microbiol. 2000;8:133–141. - PubMed

Publication types

MeSH terms