. 2007 Aug;40(4):488-507.
doi: 10.1111/j.1365-2184.2007.00449.x.

Differential impact of Cetuximab, Pertuzumab and Trastuzumab on BT474 and SK-BR-3 breast cancer cell proliferation

Affiliations

Differential impact of Cetuximab, Pertuzumab and Trastuzumab on BT474 and SK-BR-3 breast cancer cell proliferation

G Brockhoff et al. Cell Prolif. 2007 Aug.

Abstract

Objectives: The potential of epidermal growth factor receptor (EGFR)- and Her2-targeted antibodies Cetuximab, Pertuzumab and Trastuzumab, used in combination to inhibit cell proliferation of breast cancer cells in vitro, has not been extensively investigated. It is anticipated that there would be differences between specific erbB receptor co-expression profiles that would affect tumour cell growth.

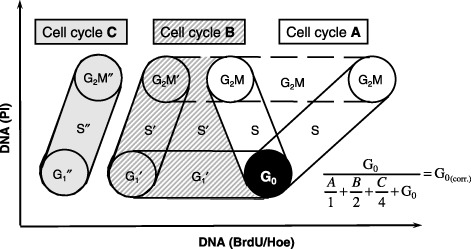
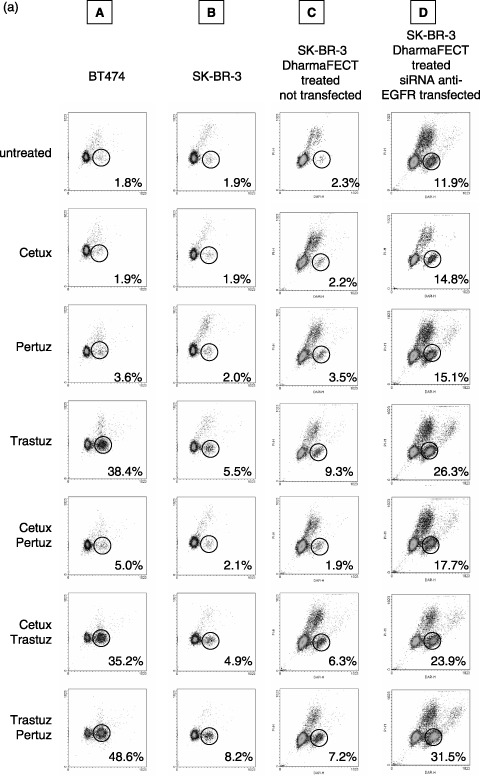
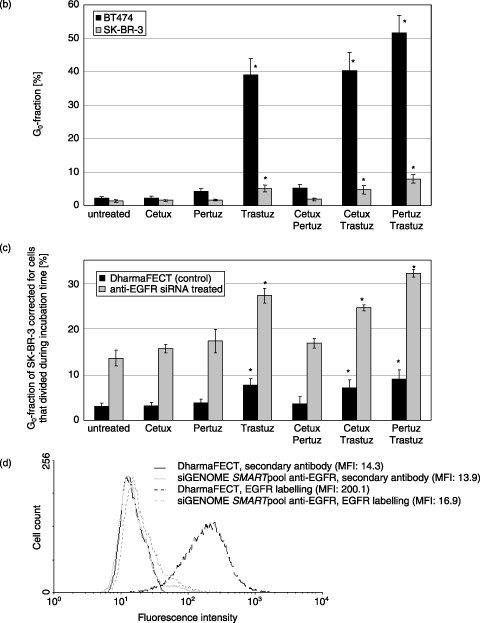
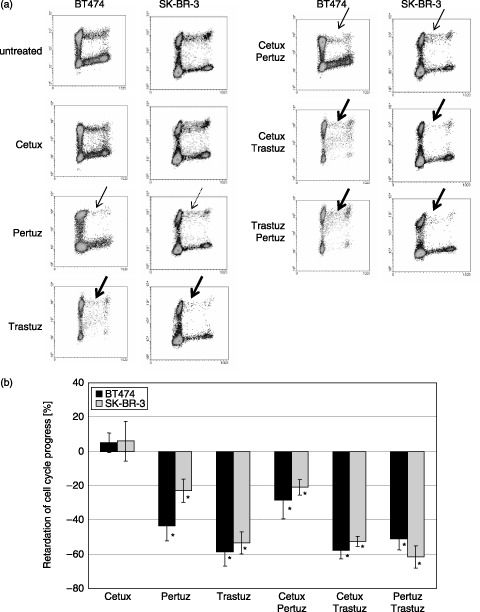
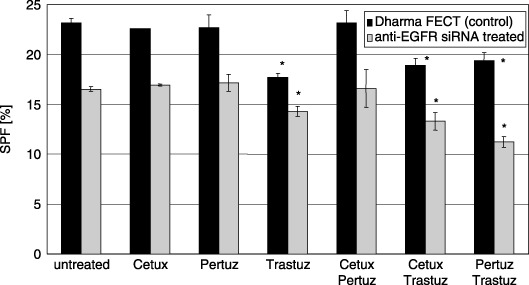
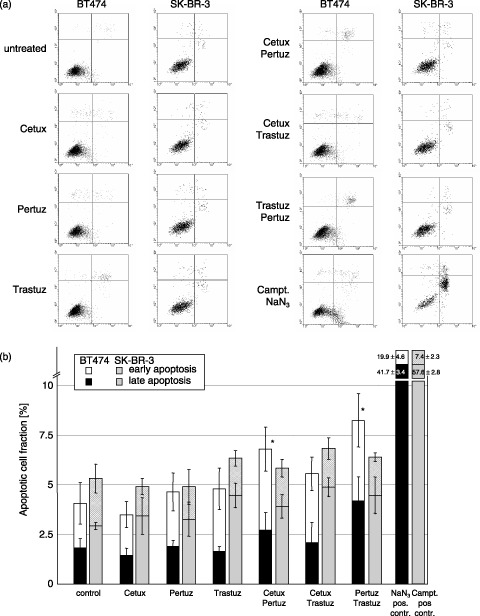
Materials and methods: We have examined the effects of Cetuximab, Pertuzumab and Trastuzumab, applied separately or in combination, on cell proliferation of BT474 and SK-BR-3 breast cancer cell lines. Cell cycle progression of BT474 and SK-BR-3 cells was statically and dynamically assessed using flow cytometry. In order to discover a potential influence of differential EGFR co-expression on sensitivity to antibody treatment, EGFR was down-regulated by siRNA in SK-BR-3. An annexinV/propidium iodide assay was used to identify potential induction of apoptosis.

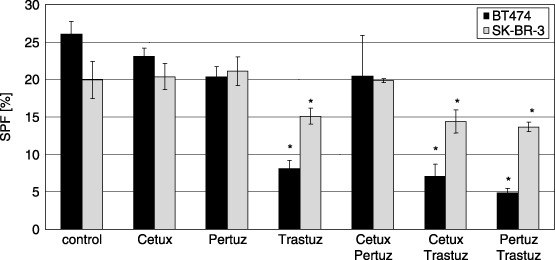
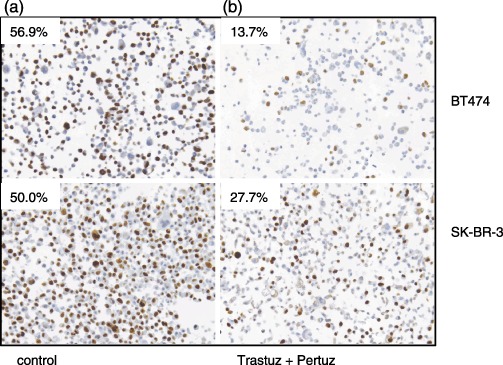
Results: Treatment with Pertuzumab and Trastuzumab, both targeted to Her2, resulted in a reduced fraction of proliferating cells, prolongation of G(1) phase and a great increase in quiescent BT474 cells. Cetuximab had no additional contribution to the effect of either Pertuzumab or Trastuzumab when administered simultaneously. Treatment with the antibodies did not induce an appreciable amount of apoptosis in either BT474 or SK-BR-3 cells. In contrast to SK-BR-3, the BT474 cell line appears to be more sensitive to antibody treatment due to low EGFR content besides Her2 overexpression.

Conclusion: The extent of decelerated or blocked cell proliferation after antibody treatment that is targeted to EGFR and to Her2 depends both on EGFR and Her2 co-expression and on antibody combination used in the treatment setting. Cetuximab did not enhance any inhibitory effect of Trastuzumab or Pertuzumab, most probably due to the dominant overexpression of Her2. Cell susceptibility to Trastuzumab/Pertuzumab, both targeted to Her2, was defined by the ratio of EGFR/Her2 co-expression.


Figures

Figure 1
Figure 1
Schematic bivariate diagram of BrdU/Hoe versus propidium iodide fluorescence intensities. The distribution of three successive cell cycles with cell cycle phases G1, S, G2/M of an asynchronous cell population continuously exposed to BrdU is shown. Superscript bars indicate the first (none), the second (′) and the third (″) cell cycle. Figures given in Fig. 4b and 4c are corrected for the cells that divided during the BrdU incubation time of 90 h. In order to calculate the number of cells that have entered G0 and do not proceed in their cell cycle due to treatment, the fraction of G0 cells was divided by the sum of (1) the number of cells that have incorporated BrdU, but have not divided (the first cycle S + G2M), (2) the number of cells that have divided once (the second cycle cells) divided by two (two cells in the second cycle have resulted from one cell in the first cycle), (3) the number of cells that have divided twice (the third cycle cells) divided by four (four cells in the third cycle have resulted from one cell in the first cycle) and (4) the number of G0 cells.
Figure 4
Figure 4
(a) Quantification of quiescent BT474 and SK‐BR‐3 cells without (columns A, B, C) and after (column D) siRNA mediated EGFR knockdown (column C = control). Cells were treated for 96 h with Cetuximab, Trastuzumab and Pertuzumab, applied separately or in pairwise combinations as indicated. Dot plots representative for a single experiment are shown. Without antibody treatment only 1.8% of BT474 and 1.9% of SK‐BR‐3 cells were found without BrdU incorporation within 90 h. The fraction of quiescent cells is strongly elevated in BT474 after Trastuzumab treatment (38.4%) and this effect is further enhanced if cells are treated with Trastuzumab and Pertuzumab simultaneously (48.6%). The fraction of quiescent SK‐BR‐3 cells is 5.5% and 8.2% induced by Trastuzumab treatment alone or in combination with Pertuzumab, respectively. Overall, Cetuximab does not increase the fraction of dormant cells; only a minor effect is seen in BT474 cells when Cetuximab is applied in combination with Pertuzumab (5% quiescent cells). The effect of antibody treatment in SK‐BR‐3 cells was evaluated after EGFR knockdown (column D). Cells treated with DharmaFECT without siRNA served as control (column C). The basal level of dormant cells in siRNA treated SK‐BR‐3 cells is higher (11.9%) than in untreated cells (1.9%), probably due to the lower EGFR content. Overall, the sensitivity to each antibody used in this study is increased after EGFR knockdown compared to normal SK‐BR‐3 cells. The most pronounced effect is observed in Trastuzumab/Pertuzumab treated cells showing 31.5% quiescent cells compared to 7.2% in the control sample. Data overview is given in Fig. 4b and 4c. Efficiency of EGFR knockdown in SK‐BR‐3 cells is demonstrated in Fig. 4d. (b) Quantification of quiescent G0‐cells in BT474 and SK‐BR‐3 cell lines after antibody treatment. Cells were treated for 96 h with Cetuximab, Trastuzumab and Pertuzumab separately or in pairwise combinations. The values for G0 cell fractions were corrected for the cell number that has divided during the BrdU labelling period as described in Materials and Methods. The data represent mean values of three independent experiments. Error bars indicate the standard deviation of the mean. * indicates statistical significance (P < 0.05) related to control. (c) G0‐fraction of SK‐BR‐3 cells without and after siGENOME SMARTpool anti‐EGFR siRNA treatment. The G0 fraction is presented in absolute numbers and corrected for the number of cells that have divided during incubation time as described in Materials and Methods. Overall, SK‐BR‐3 cells are sensitized to antibody treatment by EGFR knockdown. All treatment modalities are more effective after EGFR knockdown, represented by a larger cell fraction that is driven into quiescence by antibody treatment. The most significant effect is evident after Trastuzumab treatment (alone or in combination): The G0‐fraction after siRNA transfection is increased from 7.8% to 27.3% (by Trastuzumab treatment), from 7.2% to 24.8% (by Trastuzumab, Cetuximab treatment) and from 9.3% to 32.4% (by Trastuzumab, Pertuzumab treatment). Three independent experiments were performed. Error bars indicate the standard deviation of the mean. * indicates statistical significance (P < 0.05) related to the control. (d) EGFR knockdown in SK‐BR‐3 cells by siGENOME SMARTpool anti‐EGFR siRNA 3 days after first transfection. Mean fluorescent intensity (MFI) of EGFR staining in non‐transfected cells is 200.1 compared to DharmaFECT treated control (14.3). 96% of EGFR was homogeneously knocked down in the SK‐BR‐3 cell population by siGENOME SMARTpool anti‐EGFR transfection (MFI 16.9).
Figure 4
Figure 4
(a) Quantification of quiescent BT474 and SK‐BR‐3 cells without (columns A, B, C) and after (column D) siRNA mediated EGFR knockdown (column C = control). Cells were treated for 96 h with Cetuximab, Trastuzumab and Pertuzumab, applied separately or in pairwise combinations as indicated. Dot plots representative for a single experiment are shown. Without antibody treatment only 1.8% of BT474 and 1.9% of SK‐BR‐3 cells were found without BrdU incorporation within 90 h. The fraction of quiescent cells is strongly elevated in BT474 after Trastuzumab treatment (38.4%) and this effect is further enhanced if cells are treated with Trastuzumab and Pertuzumab simultaneously (48.6%). The fraction of quiescent SK‐BR‐3 cells is 5.5% and 8.2% induced by Trastuzumab treatment alone or in combination with Pertuzumab, respectively. Overall, Cetuximab does not increase the fraction of dormant cells; only a minor effect is seen in BT474 cells when Cetuximab is applied in combination with Pertuzumab (5% quiescent cells). The effect of antibody treatment in SK‐BR‐3 cells was evaluated after EGFR knockdown (column D). Cells treated with DharmaFECT without siRNA served as control (column C). The basal level of dormant cells in siRNA treated SK‐BR‐3 cells is higher (11.9%) than in untreated cells (1.9%), probably due to the lower EGFR content. Overall, the sensitivity to each antibody used in this study is increased after EGFR knockdown compared to normal SK‐BR‐3 cells. The most pronounced effect is observed in Trastuzumab/Pertuzumab treated cells showing 31.5% quiescent cells compared to 7.2% in the control sample. Data overview is given in Fig. 4b and 4c. Efficiency of EGFR knockdown in SK‐BR‐3 cells is demonstrated in Fig. 4d. (b) Quantification of quiescent G0‐cells in BT474 and SK‐BR‐3 cell lines after antibody treatment. Cells were treated for 96 h with Cetuximab, Trastuzumab and Pertuzumab separately or in pairwise combinations. The values for G0 cell fractions were corrected for the cell number that has divided during the BrdU labelling period as described in Materials and Methods. The data represent mean values of three independent experiments. Error bars indicate the standard deviation of the mean. * indicates statistical significance (P < 0.05) related to control. (c) G0‐fraction of SK‐BR‐3 cells without and after siGENOME SMARTpool anti‐EGFR siRNA treatment. The G0 fraction is presented in absolute numbers and corrected for the number of cells that have divided during incubation time as described in Materials and Methods. Overall, SK‐BR‐3 cells are sensitized to antibody treatment by EGFR knockdown. All treatment modalities are more effective after EGFR knockdown, represented by a larger cell fraction that is driven into quiescence by antibody treatment. The most significant effect is evident after Trastuzumab treatment (alone or in combination): The G0‐fraction after siRNA transfection is increased from 7.8% to 27.3% (by Trastuzumab treatment), from 7.2% to 24.8% (by Trastuzumab, Cetuximab treatment) and from 9.3% to 32.4% (by Trastuzumab, Pertuzumab treatment). Three independent experiments were performed. Error bars indicate the standard deviation of the mean. * indicates statistical significance (P < 0.05) related to the control. (d) EGFR knockdown in SK‐BR‐3 cells by siGENOME SMARTpool anti‐EGFR siRNA 3 days after first transfection. Mean fluorescent intensity (MFI) of EGFR staining in non‐transfected cells is 200.1 compared to DharmaFECT treated control (14.3). 96% of EGFR was homogeneously knocked down in the SK‐BR‐3 cell population by siGENOME SMARTpool anti‐EGFR transfection (MFI 16.9).
Figure 2
Figure 2
(a) Dynamic proliferation assessment of BT474 and SK‐BR‐3 cells after antibody treatment. Dotted, thin and thick lined arrows indicate low, moderate and strong inhibition of cell cycle progress compared to untreated control cells. Cetuximab treatment does not affect proliferation of both cell lines, whereas Pertuzumab slightly (SK‐BR‐3) and moderately (BT474) detains cell cycle progress. Trastuzumab is the most efficient inhibitor in both cell lines. BT474 and SK‐BR‐3 cells in G1 phase of the second cell cycle do not reenter into S phase within 50 h in the presence of Trastuzumab (data not shown), representing a significant prolongation of G1 by Trastuzumab. Simultaneous administration of Trastuzumab and Pertuzumab to BT474 and SK‐BR‐3 cells results in an additive inhibition of cell proliferation, whereas Cetuximab application does not show any inhibitory effect even in combination with Pertuzumab or Trastuzumab. (b) Cell cycle progress in BT474 and SK‐BR‐3 cells affected by antibody treatment. S/G2/M fractions in BrdU positive cells were calculated in relation to the total BrdU positive cell fraction 38 h after BrdU incubation. Cetuximab does not affect cell cycle progression in both cell lines. However, Pertuzumab and Trastuzumab decelerate the cell cycle progress by 43.4% and 58.7% (BT474) and 23% and 53.3% (SK‐BR‐3), respectively. This indicates first that Trastuzumab is more effective than Pertuzumab and second that BT474 cells are more susceptible to antibody treatment than SK‐BR‐3 cells. Treatment with a combination of two antibodies did not augment the inhibitory effect of antibodies administered separately. * indicates statistical significance (P < 0.05) related to control.
Figure 3
Figure 3
S‐phase fraction (SPF) in BT474 and SK‐BR‐3 cells after antibody treatment. SPF is significantly reduced in both cell lines in the presence of Trastuzumab. This effect is more pronounced in BT474 cells (8.1% versus 26.1%) than in SK‐BR‐3 cells (15.1% versus 19.9%). Pertuzumab reduces SPF in BT474 slightly but significantly (20.4% versus 26.1%) but not in SK‐BR‐3. Cetuximab has no significant effect on SPF in both cell lines. The effect of Trastuzumab is enhanced in both cell lines by the simultaneous administration of Pertuzumab. However, this observation is significant only in BT474 cells (4.9% versus 8.1%) but not in SK‐BR‐3 cells (13.7% versus 15.1%). Cetuximab has no additional effect on SPF when added either together with Trastuzumab or in combination with Pertuzumab. * indicates statistical significance (P < 0.05) related to control.
Figure 5
Figure 5
Ki‐67 staining by IHC in paraffin embedded preparations of BT474 and SK‐BR‐3 cells. One example for cell treatment (Tratuzumab/Pertuzumab) representing the largest change in Ki‐67 positivity according to Table 1 is shown for each cell line and compared to untreated cells. The numbers represent the fraction of Ki‐67 positive cells. Samples treated with Trastuzumab and Pertuzumab in combination (b) show fewer Ki‐67‐positive cells compared to control cells (a).
Figure 6
Figure 6
S‐phase fraction (SPF) of SK‐BR‐3 cells after antibody treatment without and after siGENOME SMART pool anti‐EGFR siRNA transfection. Cetuximab and Pertuzumab have no effect on SPF in SK‐BR‐3 cells either with or without EGFR down‐regulation. In DharmaFECT treated control cells (black bars) the SPF is reduced from 23.2% to 17.9% with Trastuzumab treatment, to 18.9% with Cetuximab/Trastuzumab treatment and to 19.4% with Pertuzumab/Trastuzumab treatment. In EGFR‐down‐regulated cells (grey columns), the SPF of untreated cells is reduced from 16.6% to 14.3% with Trastuzumab treatment, to 13.3% with Cetuximab/Trastuzumab treatment and to 11.3% with Pertuzumab/Trastuzumab treatment. The decrease in SPF upon Trastuzumab treatment compared to untreated cells is 22.9% in DharmaFECT control cells and 13.6% in EGFR‐down‐regulated cells. The correlation is reversed for combination treatment of Trastuzumab and Pertuzumab. SPF is decreased by 16.4% in DharmaFECT control cells and by 32% in EGFR‐down‐regulated SK‐BR‐3. For Cetuximab/Trastuzumab treatment the decrease in SPF compared to untreated cells is similar for DharmaFECT control cells (18.5%) and EGFR‐down‐regulated cells (19.6%). * indicates statistical significance (P < 0.05) related to control.
Figure 7
Figure 7
(a) Quantification of apoptotic cells by annexinV/propidium iodide (PI) staining. Compared to untreated cells, NaN3 or Camptothecin treatment (positive controls for BT474 and SK‐BR‐3, respectively) induced a significant amount of early (annexinV positive) and late (annexinV/PI double positive) apoptotic cells. However, none of the antibodies used in this study was able to induce apoptosis in BT474 or SK‐BR‐3 cells when administered individually. Only after Cetuximab/Pertuzumab (7.0% versus 4%) and Pertuzumab/Trastuzumab (7.9% versus 4%) treatment of BT474 cells, a small but significant increase in the apoptotic cell fraction could be observed. (b) Apoptotic cell fractions in BT474 and SK‐BR‐3 cell lines after antibody treatment. * indicates statistical significance (P < 0.05) related to control.

References

    1. Adams CW, Allison DE, Flagella K, Presta L, Clarke J, Dybdal N, McKeever K, Sliwkowski MX (2006) Humanization of a recombinant monoclonal antibody to produce a therapeutic HER dimerization inhibitor, Pertuzumab. Cancer Immunol. Immunother. 55, 717–727. - PMC - PubMed
    1. Adams GP, Weiner LM (2005) Monoclonal antibody therapy of cancer. Nat Biotechnol. 23, 1147–1157. - PubMed
    1. Agus DB, Gordon MS, Taylor C, Natale RB, Karlan B, Mendelson DS, Press MF, Allison DE, Sliwkowski MX, Lieberman G, Kelsey SM, Fyfe G (2005) Phase I clinical study of Pertuzumab, a novel HER dimerization inhibitor, in patients with advanced cancer. J. Clin. Oncol. 23, 2534–2543. - PubMed
    1. Badache A, Hynes NE (2004) A new therapeutic antibody masks ErbB2 to its partners. Cancer Cell 5, 299–301. - PubMed
    1. Balin‐Gauthier D, Delord JP, Rochaix P, Mallard V, Thomas F, Hennebelle I, Bugat R, Canal P, Allal C (2006) In vivo and in vitro antitumor activity of oxaliplatin in combination with Cetuximab in human colorectal tumor cell lines expressing different level of EGFR. Cancer Chemother Pharmacol. 57, 709–718. - PubMed

Publication types

MeSH terms