. 2007 Aug;40(4):532-49.
doi: 10.1111/j.1365-2184.2007.00448.x.

Different effects of ribosome biogenesis inhibition on cell proliferation in retinoblastoma protein- and p53-deficient and proficient human osteosarcoma cell lines

Affiliations

Different effects of ribosome biogenesis inhibition on cell proliferation in retinoblastoma protein- and p53-deficient and proficient human osteosarcoma cell lines

L Montanaro et al. Cell Prolif. 2007 Aug.

Abstract

Objectives: To evaluate the effects of rRNA synthesis inhibition on cell cycle progression and cell population growth according to the RB and p53 status.

Material and methods: RB- and p53-proficient U2OS cells and the RB- and p53-deficient SAOS-2 cells were used, rRNA transcription hindered by actinomycin D, and cell cycle analysed by flow cytometry.

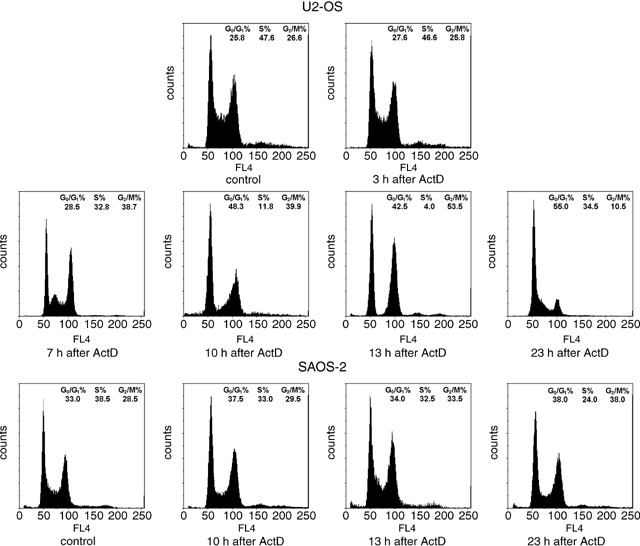
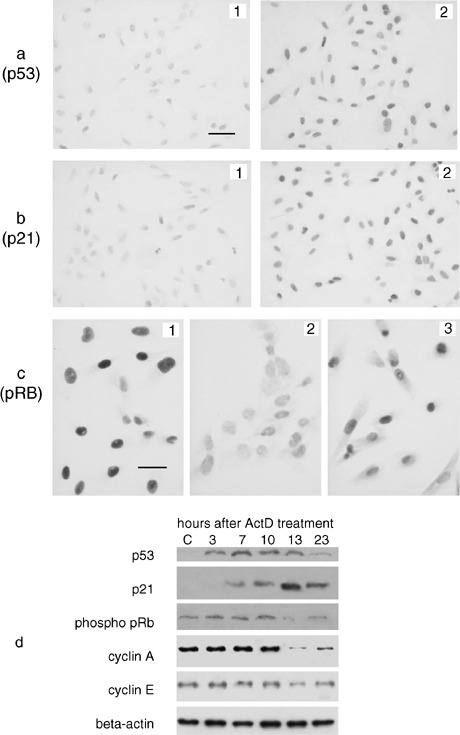
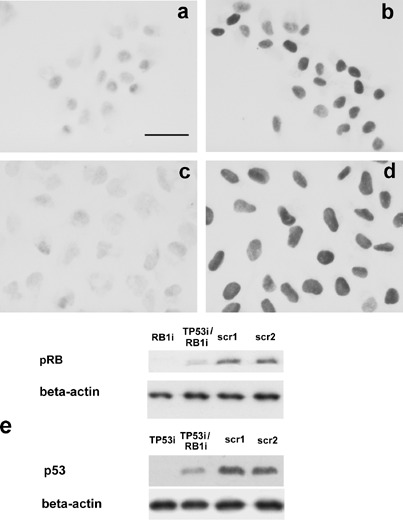
Results: One hour of actinomycin D treatment induced in U2OS cells a block at the cell cycle checkpoints G(1)-S and G(2)-M, which was removed only after rRNA synthesis was resumed. rRNA synthesis inhibition did not influence cell cycle progression in SAOS-2 cells. No effect on cell cycle progression after actinomycin D-induced rRNA inhibition was also found in U2OS cells silenced for RB and p53 expression. A mild perturbation of cell cycle progression was observed in U2OS cells silenced for the expression of either RB or p53 alone. We also treated U2OS and SAOS-2 cells with actinomycin D for 1 h/day for 5 days. This treatment lightly reduced growth rate of the U2OS cell population, whereas cell population growth of SAOS-2 cells was completely inhibited. A marked reduction of ribosome content occurred in SAOS-2 cells after the long-term actinomycin D treatment, whereas no modification was observed in U2OS cells.

Conclusions: These results demonstrate that inhibition of ribosome biogenesis does not hinder cell cycle progression in RB- and p53-deficient cells. A daily-repeated transitory inhibition of ribosome biogenesis leads to a progressive reduction of ribosome content with the consequent extinction of cancer cell population lacking RB and p53.


Figures

Figure 1
Figure 1
Representative flow cytometric DNA profiles of asynchronously growing U2OS and SAOS‐2 cells after DAPI staining. U2OS cells treated with ActD for 1 h were analysed 3, 7,10, 13 and 23 h after the end of drug treatment. Note the cell accumulation in G0/G1 and G2 + M phases at 10 and, mainly, at 13 h after the end of ActD treatment, indicating that a block in cell cycle progression has occurred at this latter time. At 23 h after the end of ActD treatment, the DNA profile shows a transition of cells from G0/G1 to S phase and from G2 + M to G1 phase, indicating a restart of cell cycle progression. In SAOS‐2 cells treated with ActD for 1 h and analysed 10, 13 and 23 h after the end of drug treatment, the flow cytometric DNA profiles are similar to that of control SAOS‐2 cells, indicating that the cell cycle progression is not affected by ActD treatment. The values of the percentage of the cells in the cell cycle phases reported in the upper right represent the mean of three different measurements.
Figure 2
Figure 2
Effect of ActD treatment on the expression of cell cycle related proteins in U2OS cells. (a) Immunocytochemical visualization of p53. In control cells (a1) the nuclei appear to be very weakly stained (bar = 25 µm). Four hour after ActD treatment all U2OS cell nuclei appear to be positive for p53 immunostaining (a2). (b) Immunocytochemical visualization of p21. No or very lightly stained nuclei are detectable in control cells (b1). Many cell nuclei appear to be stained 7 h after the end of ActD treatment (b2). Same magnification as in Fig. 2a. (c) Phosphorylated pRB immunostaining. In control cells (c1) intensely stained nuclei are present (Bar = 12.5 µm). In ActD‐treated cells (c2), at 13 h after the end of drug treatment, all the nuclei appear to be very faintly stained. At 23 h after the end of ActD treatment (c3), the staining intensity of cell nuclei appears to be higher than in Fig. 2c. (d) Western blot analysis of cell cycle related proteins in U2OS control (C) and ActD‐treated cells, evaluated 3, 7, 10, 13 and 23 h after the end of drug treatment. Note the early increase of p53 level, followed by the increase of p21 with the contemporary reduction of the expression of the hyper‐phosphorylated form of pRB, cyclin A and cyclin E, at 13 h after the end of ActD treatment. The level of these changes appears to be reduced at 23 h after the end of drug treatment.
Figure 3
Figure 3
pRB and p53 immunocytochemical staining of U2OS cells either silenced for both tumour suppressors (3a and 3c) or transfected with scrambled sequences (3b and 3d). Monoclonal antibodies versus total RB (3a and 3b) and versus p53 (3c and 3d) were used. Cells silenced for pRB showed very weakly stained nuclei (3a), whereas nuclei of cells transfected with the scrambled sequences appeared to be deeply stained (3b). After ActD treatment, cells silenced for p53 showed a very weak immuno‐staining (3c) whereas the intensity of the staining reaction was very high in cells transfected with the scrambled sequences (3d). Bar = 10 µm. (e) Western blot analysis of pRB and p53 after specific RNA interference. The expression of pRB is strongly reduced in single (RB1i) and double (TP53i/RB1i) silenced samples in comparison to samples transfected with scrambled sequences (scr1, scr2). In cell treated with ActD to stabilize p53, the expression of p53 is very low in single (TP53i) and double (TP53i/RB1i) silenced samples.
Figure 4
Figure 4
Representative flow cytometric DNA profiles, of asynchronously growing U2OS cells silenced for RB and p53, and untreated (–ActD) or treated (+ActD) with ActD for 1 h and analysed 13 h after the end of the drug treatment. Comparrison between the profiles of cells transfected with the scrambled sequences show an accumulation of cells in G0/G1 phase and a marked reduction of cells in S phase after ActD treatment. No significant differences are visible between the profiles of untreated and ActD‐treated cells, silenced for both RB and TP53. Comparison between the profiles of cells silenced for RB show a moderate increase of the percentage of cells in G2 + M phase after ActD treatment. The same change appears to occur in cells silenced for TP53 after ActD treatment. The values of the percentage of the cells in the cell cycle phases reported in the upper right were the mean of measurements of at least three samples.
Figure 5
Figure 5
Effect of a daily ActD treatment (0.04 µg/mL for 1 h) on U2OS and SAOS‐2 cell population growth. (a) Variation of cell number (relative growth) is referred to the number of the cells at time 0. ActD treatment only lightly reduced the expansion of the U2OS cell line. In contrast, since the second day of treatment, the drug completely inhibits the growth of SAOS‐2 cell population. (b) Effect of daily repeated 1‐h ActD treatment on cell mortality of SAOS‐2 cells. Cell viability was assessed by trypan blue exclusion test. Box plots show percentages of dead cells. The median dead cell value is depicted by horizontal bars, the interquartile range by boxes, and the minimum and maximum values by vertical bars. No dead cell is present in control cells (0 h). A steep progressive increase of cell mortality rate can be observed after the first and the second day of drug treatment. (c, d) SAOS‐2 cells stained by DAPI and sulforodamine for the visualization of apoptotic figures. Control cells showing uniformly stained nuclei; no apoptotic figure is visible (5c). In the ActD‐treated cells (5d) several apoptotic figures can be recognized after the second day of 1‐h daily repeated ActD treatment. Fragmented nuclei (1), faintly stained nuclei with partial loss of DNA (2), and cells without stained nuclear material (3) are present. (e) rRNA content in U2OS and SAOS‐2 cells untreated (C) and treated (ActD) with ActD (0.04 µ/mL for 1 h a day) for 4 days. RNA was size separated on 1% agarose gel and stained with ethidium bromide. Two bands corresponding to 28S and 18S rRNA are visible in each lane. The intensity of the staining of both bands is reduced in SAOS‐2 cells treated with ActD.

References

    1. Bhat KP, Itahana K, Jin A, Zhang Y (2004) Essential role of ribosomal protein L11 in mediating growth inhibition‐induced p53 activation. EMBO J. 23, 2402–2412. - PMC - PubMed
    1. Budde A, Grummt I (1999) p53 represses ribosomal gene transcription. Oncogene 18, 1119–1124. - PubMed
    1. Bunz F, Dutriaux A, Lengauer C, Waldman T, Zhou S, Brown JP, Sedivy JM, Kinzler KW, Vogelstein B (1998) Requirement for p53 and p21 to sustain G2 arrest after DNA damage. Science 282, 1497–1501. - PubMed
    1. Chandar N, Billig B, McMaster J, Novak J (1992) Inactivation of p53 gene in human and murine osteosarcoma cells. Br. J. Cancer 65, 208–214. - PMC - PubMed
    1. Classon M, Harlow E (2002) The retinoblastoma tumour suppressor in development and cancer. Nat. Rev. Cancer 2, 910–917. - PubMed

Publication types

MeSH terms