

B cells modulate T cells so as to favour T helper type 1 and CD8+ T-cell responses in the acute phase of Trypanosoma cruzi infection
- PMID: 17635611
- PMCID: PMC2266037
- DOI: 10.1111/j.1365-2567.2007.02677.x
B cells modulate T cells so as to favour T helper type 1 and CD8+ T-cell responses in the acute phase of Trypanosoma cruzi infection
Abstract
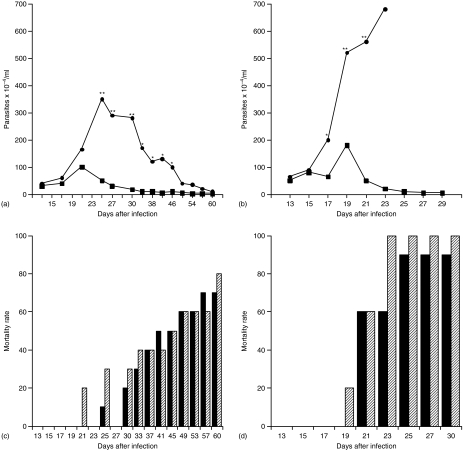
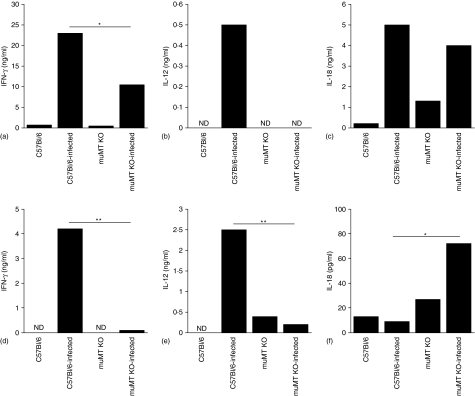
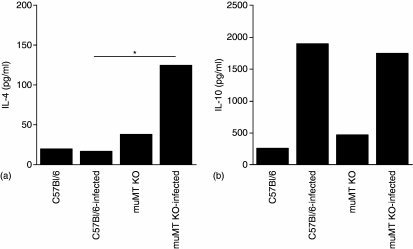
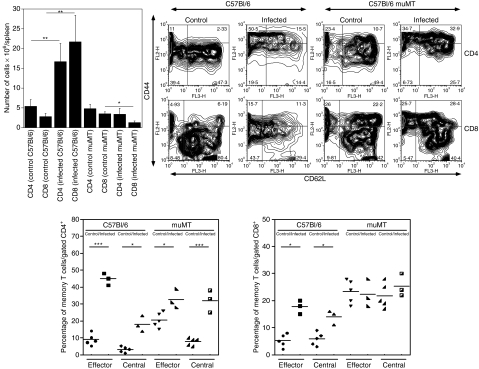
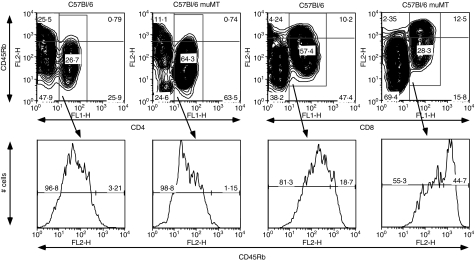
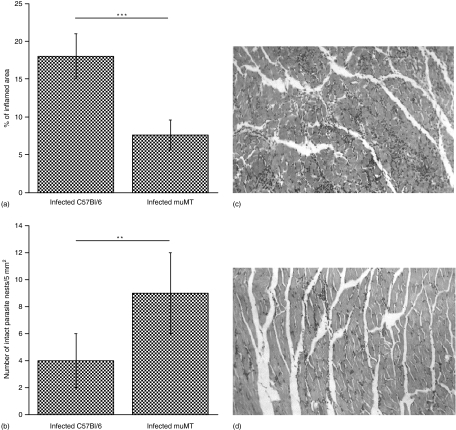
In this study, we have evaluated the production of pro- and anti-inflammatory cytokines and the formation of central and effector memory T cells in mice lacking mature B cells (mu MT KO). The results show that Trypanosoma cruzi infection in C57Bl/6m mu MT KO mice is intensified in relation to control mice and this exacerbation is related to low levels of inflammatory cytokines produced during the acute infection and the lower numbers of central and effector memory CD4(+) and CD8(+) T cells generated during the acute phase of the infection. In addition, a marked reduction in the CD8(+) T-cell subpopulation was observed in mu MT KO infected mice. In agreement to this, the degree of tissue parasitism was increased in mu MT mice and the tissue inflammatory response was much less intense in the acute phase of the infection, consistent with a deficit in the generation of effector T cells. Flow cytometry analysis of the skeletal muscle inflammatory infiltrate showed a predominance of CD8(+) CD45Rb low in B-cell-sufficient C57Bl/6 mice, whereas the preponderant cell type in mu MT KO skeletal muscle inflammatory infiltrate was CD4(+) T cells. In addition, CD8(+) T cells found in skeletal muscle from mu MT KO infected mice were less activated than in control B-cell sufficient infected mice. These results suggest that B cells may participate in the generation of effector/memory T cells. In addition and more importantly, B cells were crucial in the maintenance of central and effector memory CD8(+) T cell, as well as the determination of the T cell cytokine functional pattern, and they may therefore account for critical aspects of the resistance to intracellular pathogens, such as T. cruzi.
Figures
Similar articles
-
TGF-beta regulates pathology but not tissue CD8+ T cell dysfunction during experimental Trypanosoma cruzi infection.Eur J Immunol. 2007 Oct;37(10):2764-71. doi: 10.1002/eji.200737033. Eur J Immunol. 2007. PMID: 17823982
-
Quantitative analysis of the influenza virus-specific CD4+ T cell memory in the absence of B cells and Ig.J Immunol. 1996 Oct 1;157(7):2947-52. J Immunol. 1996. PMID: 8816401
-
Generation, specificity, and function of CD8+ T cells in Trypanosoma cruzi infection.Immunol Rev. 2004 Oct;201:304-17. doi: 10.1111/j.0105-2896.2004.00183.x. Immunol Rev. 2004. PMID: 15361249 Review.
-
Trypanosoma cruzi: IL-10, TNF, IFN-gamma, and IL-12 regulate innate and acquired immunity to infection.Exp Parasitol. 1996 Nov;84(2):231-44. doi: 10.1006/expr.1996.0109. Exp Parasitol. 1996. PMID: 8932773
-
Towards a cellular definition of CD8+ T-cell memory: the role of CD4+ T-cell help in CD8+ T-cell responses.Curr Opin Immunol. 2004 Jun;16(3):259-63. doi: 10.1016/j.coi.2004.03.004. Curr Opin Immunol. 2004. PMID: 15134772 Review.
Cited by
-
Importance of the CCR5-CCL5 axis for mucosal Trypanosoma cruzi protection and B cell activation.J Immunol. 2011 Aug 1;187(3):1358-68. doi: 10.4049/jimmunol.1100033. Epub 2011 Jun 29. J Immunol. 2011. PMID: 21715689 Free PMC article.
-
MCP-1/CCR2 interactions direct migration of peripheral B and T lymphocytes to the thymus during acute infectious/inflammatory processes.Eur J Immunol. 2012 Oct;42(10):2644-54. doi: 10.1002/eji.201242408. Epub 2012 Aug 15. Eur J Immunol. 2012. PMID: 22740067 Free PMC article.
-
IL-10-Dependent and -Independent Mechanisms Are Involved in the Cardiac Pathology Modulation Mediated by Fenofibrate in an Experimental Model of Chagas Heart Disease.Front Immunol. 2020 Sep 24;11:572178. doi: 10.3389/fimmu.2020.572178. eCollection 2020. Front Immunol. 2020. PMID: 33072115 Free PMC article.
-
Thymic expression of IL-4 and IL-15 after systemic inflammatory or infectious Th1 disease processes induce the acquisition of "innate" characteristics during CD8+ T cell development.PLoS Pathog. 2019 Jan 4;15(1):e1007456. doi: 10.1371/journal.ppat.1007456. eCollection 2019 Jan. PLoS Pathog. 2019. PMID: 30608984 Free PMC article.
-
Differential Activation of Human Monocytes and Lymphocytes by Distinct Strains of Trypanosoma cruzi.PLoS Negl Trop Dis. 2015 Jul 6;9(7):e0003816. doi: 10.1371/journal.pntd.0003816. eCollection 2015. PLoS Negl Trop Dis. 2015. PMID: 26147698 Free PMC article.
References
-
- Andrade LO, Andrews NW. The Trypanosoma cruzi-host-cell interplay: location, invasion, retention. Nat Rev Microbiol. 2005;3:819–23. - PubMed
-
- Andrade SG. Trypanosoma cruzi: clonal structure of parasite strains and the importance of principal clones. Mem Inst Oswaldo Cruz. 1999;94(Suppl. 1):185–7. - PubMed
-
- Melo RC, Brener Z. Tissue tropism of different Trypanosoma cruzi strains. J Parasitol. 1978;64:475–82. - PubMed
-
- Andrade SG, Andrade V, Brodskyn C, Magalhaes JB, Netto MB. Immunological response of Swiss mice to infection with three different strains of Trypanosoma cruzi. Ann Trop Med Parasitol. 1985;79:397–407. - PubMed
-
- Andrade V, Barral-Netto M, Andrade SG. Patterns of resistance of inbred mice to Trypanosoma cruzi are determined by parasite strain. Braz J Med Biol Res. 1985;18:499–506. - PubMed
Publication types
MeSH terms
Substances
LinkOut - more resources
Full Text Sources
Medical
Research Materials
