. 2007 Jul 16;178(2):209-18.
doi: 10.1083/jcb.200612031.

Heterochromatin is refractory to gamma-H2AX modification in yeast and mammals

Affiliations

Heterochromatin is refractory to gamma-H2AX modification in yeast and mammals

Jung-Ae Kim et al. J Cell Biol. .

Abstract

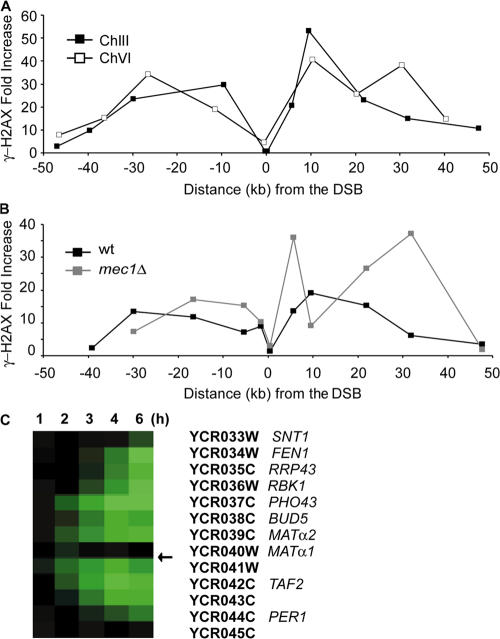
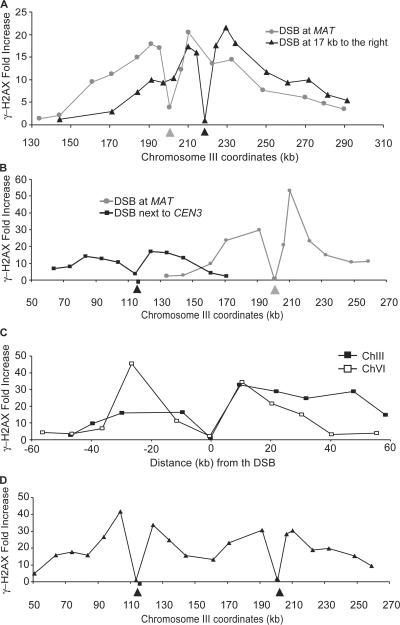
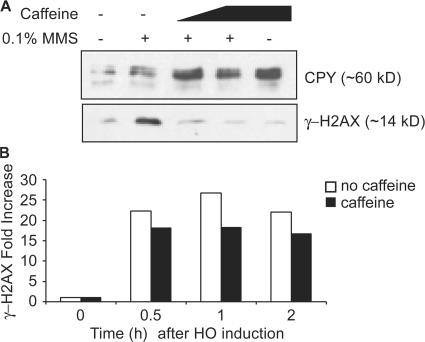
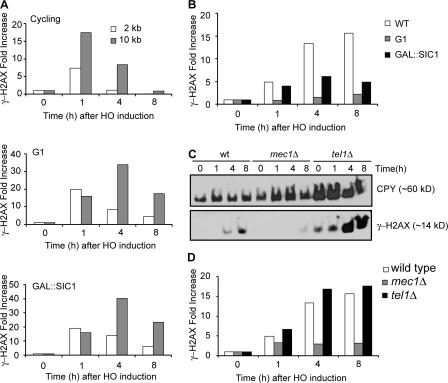
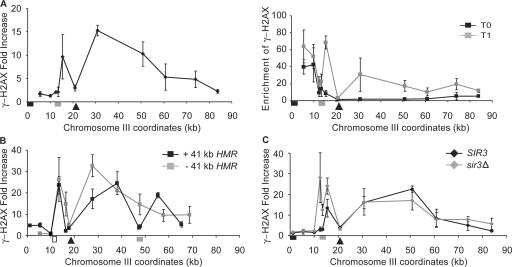
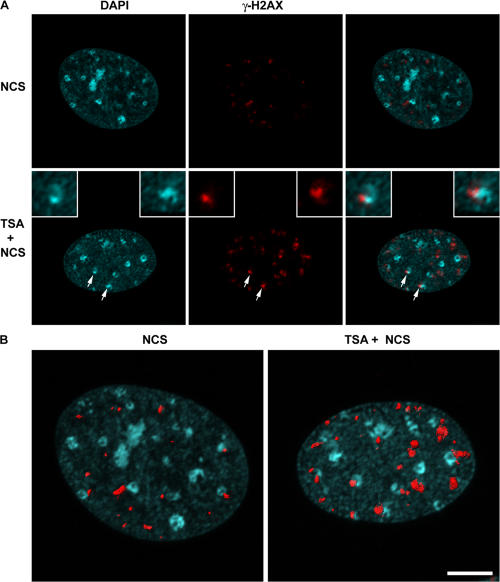
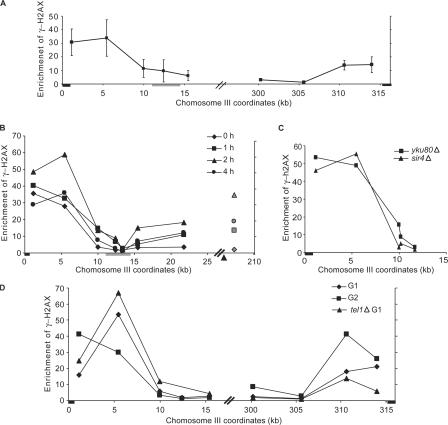
Double-strand break (DSB) damage in yeast and mammalian cells induces the rapid ATM (ataxia telangiectasia mutated)/ATR (ataxia telangiectasia and Rad3 related)-dependent phosphorylation of histone H2AX (gamma-H2AX). In budding yeast, a single endonuclease-induced DSB triggers gamma-H2AX modification of 50 kb on either side of the DSB. The extent of gamma-H2AX spreading does not depend on the chromosomal sequences. DNA resection after DSB formation causes the slow, progressive loss of gamma-H2AX from single-stranded DNA and, after several hours, the Mec1 (ATR)-dependent spreading of gamma-H2AX to more distant regions. Heterochromatic sequences are only weakly modified upon insertion of a 3-kb silent HMR locus into a gamma-H2AX-covered region. The presence of heterochromatin does not stop the phosphorylation of chromatin more distant from the DSB. In mouse embryo fibroblasts, gamma-H2AX distribution shows that gamma-H2AX foci increase in size as chromatin becomes more accessible. In yeast, we see a high level of constitutive gamma-H2AX in telomere regions in the absence of any exogenous DNA damage, suggesting that yeast chromosome ends are transiently detected as DSBs.


Figures

Figure 1.
Figure 1.
γ-H2AX spreads ∼50 kb on either side of a DSB. (A) Distribution of γ-H2AX in response to a DSB either at MAT in chromosome III (black squares) or at ∼97 kb from the left end of chromosome VI (white squares). γ-H2AX ChIP values on either side of the DSB were examined by quantitative PCR using primer pairs at the points indicated. The signal at each locus was normalized to the signal of the control locus, CEN8, and the increase seen 1 h after DSB induction was calculated by normalizing with the results before HO induction. (B) Distribution of γ-H2AX in response to a DSB at MAT in chromosome III either in the wild-type (wt; black squares) or mec1Δ cells (gray squares). γ-H2AX ChIP values on either side of the DSB were examined by quantifying PCR fragments on the agarose gel with Quantity One. (C) Changes in mRNA levels in genes near an HO-induced DSB at MAT. In yeast cells arrested in G2 in nocodazole, HO endonuclease was expressed, and changes in mRNA levels were analyzed by microarray. The location of HO cleavage is marked with an arrow. No change in gene expression is seen for genes lying within 50 kb of the DSB in the first hour, although as the DNA in this region becomes single stranded by 5′ to 3′ resection at roughly 4 kb/h, the levels of mRNA decrease (green) progressively as a function of distance from the DSB. Complete data can be found at http://db-dev.yeastgenome.org/cgi-bin/expression/expressionConnection.pl. A version of this figure was previously published by Lee et al. (2000).
Figure 2.
Figure 2.
The second DSB does not affect the extent of γ-H2AX spreading. (A) Lack of a barrier to γ-H2AX spreading to the right of MAT. A 117-bp HO cut site was inserted 17 kb to the right of the normal cleavage site, which was deleted (triangles) in the cells lacking the normal HO recognition site. There are general shifts of γ-H2AX modification with the displaced cut sites relative to cleavage at MAT (circles). The position of each DSB is pointed by arrowheads. (B) Lack of a barrier to γ-H2AX spreading to the right of CEN3. A 117-bp HO cut site was inserted 600 bp to the left of CEN3 in the cells lacking the normal HO recognition site (squares). γ-H2AX ChIP values on either side of the DSB were measured by quantitative PCR. The extent of γ-H2AX modification with the displaced cut site is similar to that with the normal HO recognition site at MAT (circles). The position of each DSB is pointed to by arrowheads, and the position of CEN3 is denoted with a square. (C) Simultaneous DSBs at MAT (black squares) and chromosome VI (white squares) did not change the extent of γ-H2AX spreading, as measured either on chromosome III or chromosome VI. (D) Simultaneous DSBs on chromosome III, at MAT, and ∼600 bp to the left of CEN3 did not significantly increase the extent of γ-H2AX spreading. The position of each DSB is marked by arrowheads, and the position of CEN3 is denoted with a square.
Figure 3.
Figure 3.
γ-H2AX is not removed from DNA by rapid turnover. (A) Cells were grown to log phase and treated with 0.1% MMS for 1 h. 10 or 20 mg/ml of caffeine was added at the same time when MMS was added to the culture. The activity of Mec1p and Tel1p kinases was examined by their ability to generate γ-H2AX, as shown by Western blot analysis. The CPY (carboxy peptidase Y) protein was used as a loading control. (B) A DSB was generated at MAT by HO induction. After 30 min, 10 mg/ml of caffeine was added into the cell culture to inhibit continued Mec1 and Tel1 kinase activity. γ-H2AX ChIP signals before HO induction as well as 0.5, 1, and 2 h after HO induction were examined.
Figure 4.
Figure 4.
Dynamics of γ-H2AX as DNA end resection proceeds. (A) γ-H2AX ChIP values either at 2 kb or at 10 kb to the right of the DSB at MAT were measured 1, 4, and 8 h after HO induction and were normalized with the value before HO induction (0 h). Three different cultures were examined: asynchronous cells (top), G1-arrested cells (middle), and SIC1-overexpressing cells (bottom). Quantitative PCR analysis was performed to measure γ-H2AX ChIP signals. (B) γ-H2AX ChIP values at 70 kb to the right of the DSB at MAT in three different cultures: asynchronous cells (white bars), G1-arrested cells (gray bars), and SIC1-overexpressing cells (black bars). (C) Cellular level of γ-H2AX after HO induction. A DSB was generated at MAT in derivatives of JKM179 deleted for HML and HMR: wild type (wt), mec1Δ, and tel1Δ. Cells were collected at 1, 4, and 8 h after HO induction as well as before HO induction, and protein extracts were subjected to Western blot analysis against either γ-H2AX or CPY. (D) γ-H2AX ChIP values at 70 kb to the right of the DSB at MAT were examined by quantitative PCR in the wild-type (white bars), mec1Δ (gray bars), and tel1Δ cells (black bars).
Figure 5.
Figure 5.
Effect of heterochromatin in HML and HMR on γ-H2AX spreading. (A) A DSB (arrowhead) was generated at ∼7 kb from HML (gray box). The γ-H2AX ChIP signal was examined by quantitative PCR. The increase in γ-H2AX after HO induction (left) was calculated by normalizing the γ-H2AX ChIP signal at 1 h after HO induction (gray squares) with that before HO induction (black squares; right). The position of the telomere is marked with a black box. (B) The HMR sequences, including its own silencers (gray box), was introduced ∼41 kb from the left end of chromosome III, in which HML was replaced by LEU2 (white box). A DSB (arrowhead) led to increased γ-H2AX ∼50 kb to the right in the absence (gray squares) or presence (black squares) of the ectopic HMR sequence, but there is much less modification over HMR. (C) A DSB was generated ∼7 kb to the right of HMLα-inc (gray box). The level of γ-H2AX in a SIR3 (black diamonds) or sir3Δ (gray diamonds) strain are compared. Error bars represent one SEM.
Figure 6.
Figure 6.
Distribution of phosphorylated H2AX in mouse embryo fibroblasts containing hyperacetylated histones. γ-H2AX foci in wild-type cells treated with either NCS or TSA and NCS. Confocal image stacks through the depth of the cell nucleus (z axis) were collected with an optical slice thickness of 800 nm. (A) Representative single optical slice of γ-H2AX foci in NCS-treated (top) and TSA + NCS–treated (bottom) cells. Images were collected with identical imaging parameters and contrast adjustments (histogram stretching). Arrows denote two separate γ-H2AX foci adjacent to pericentric heterochromatin that are shown at higher magnification in the top left and right insets. (B) The same cell nucleus as in A but shown as a 3D volume reconstruction, with the surface rendering of individual foci shown in red superimposed on the DAPI image, which is shown in blue. Images were background subtracted, and volume reconstructions were generated using Imaris software, from which the volumes of individual foci were measured (see Materials and methods). Bar, 5 μm.
Figure 7.
Figure 7.
Distribution of γ-H2AX near the telomere. (A) γ-H2AX ChIP at subtelomeric regions of chromosome III (left and right) in the absence of exogenous DNA damage normalized by the γ-H2AX ChIP signal at CEN8. The black boxes denote the positions of telomere sequences. The location of HML is indicated by the gray box. (B) cdc13-1 mutant cells were grown at 25°C in log phase and shifted to 37°C at the same time when HO was induced by adding galactose into the culture. γ-H2AX near the telomere, TEL03L, as well as ∼20 kb to the right of the HO-induced DSB at MAT (gray symbols) were examined by ChIP and normalized to the signal at CEN8. Samples were collected before temperature shift and HO induction (diamonds) and at 1 (squares), 2 (triangles), and 4 (circles) h. The arrowhead indicates the location of HO-induced DSB. The black box denotes the position of TEL03L. The location of HML is indicated by the gray box. (C) The constitutive level of γH2AX near TEL03L was examined in the sir4Δ strain (triangles) and in the yku80Δ strain (squares) by ChIP. The black box indicates TEL03L. (D) The constitutive level of γH2AX near TEL03L and TEL03R was examined in G1-arrested cells (diamonds) after α-factor arrest and in G2-arrested cells (squares) after nocodazole treatment. γ-H2AX was also examined in the G1-arrested tel1Δ strain (triangles). The black boxes indicate TEL03L and TEL03R. Error bars represent SEM.

References

    1. Bassing, C.H., K.F. Chua, J. Sekiguchi, H. Suh, S.R. Whitlow, J.C. Fleming, B.C. Monroe, D.N. Ciccone, C. Yan, K. Vlasakova, et al. 2002. Increased ionizing radiation sensitivity and genomic instability in the absence of histone H2AX. Proc. Natl. Acad. Sci. USA. 99:8173–8178. - PMC - PubMed
    1. Bloom, K.S., and J. Carbon. 1982. Yeast centromere DNA is in a unique and highly ordered structure in chromosomes and small circular minichromosomes. Cell. 29:305–317. - PubMed
    1. Booth, C., E. Griffith, G. Brady, and D. Lydall. 2001. Quantitative amplification of single-stranded DNA (QAOS) demonstrates that cdc13-1 mutants generate ssDNA in a telomere to centromere direction. Nucleic Acids Res. 29:4414–4422. - PMC - PubMed
    1. Celeste, A., S. Petersen, P.J. Romanienko, O. Fernandez-Capetillo, H.T. Chen, O.A. Sedelnikova, B. Reina-San-Martin, V. Coppola, E. Meffre, M.J. Difilippantonio, et al. 2002. Genomic instability in mice lacking histone H2AX. Science. 296:922–927. - PMC - PubMed
    1. Celeste, A., O. Fernandez-Capetillo, M.J. Kruhlak, D.R. Pilch, D.W. Staudt, A. Lee, R.F. Bonner, W.M. Bonner, and A. Nussenzweig. 2003. Histone H2AX phosphorylation is dispensable for the initial recognition of DNA breaks. Nat. Cell Biol. 5:675–679. - PubMed

Publication types

MeSH terms