. 2007 Jul 16;178(2):323-35.
doi: 10.1083/jcb.200705094.

A molecular mechanism directly linking E-cadherin adhesion to initiation of epithelial cell surface polarity

Affiliations

A molecular mechanism directly linking E-cadherin adhesion to initiation of epithelial cell surface polarity

Lene N Nejsum et al. J Cell Biol. .

Abstract

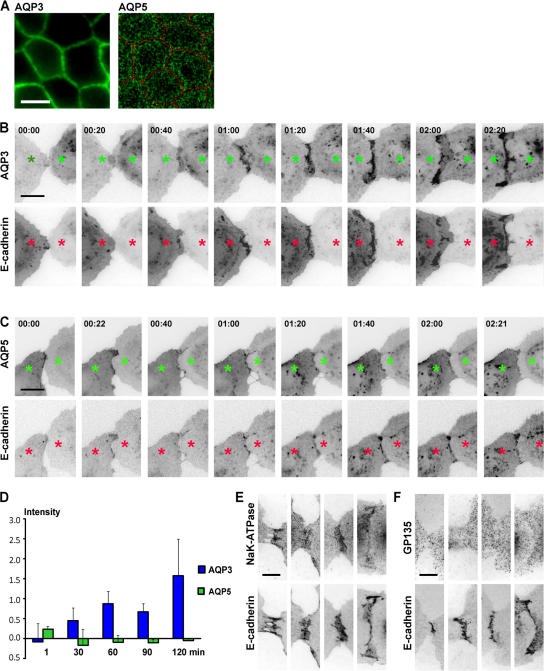
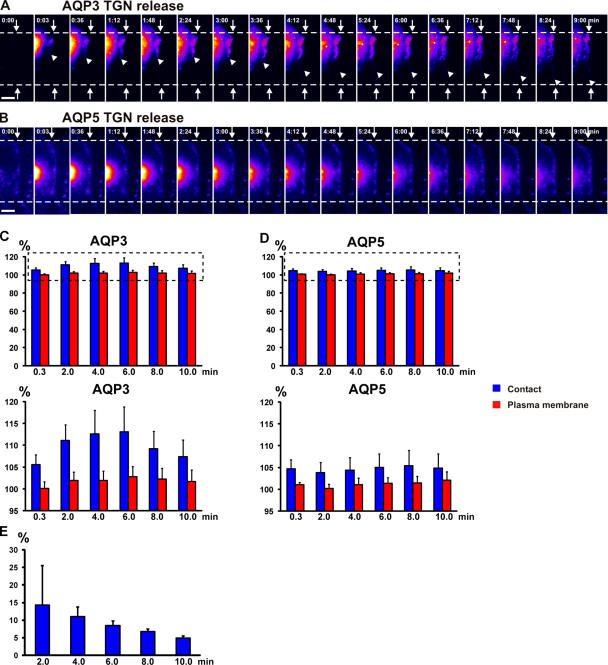
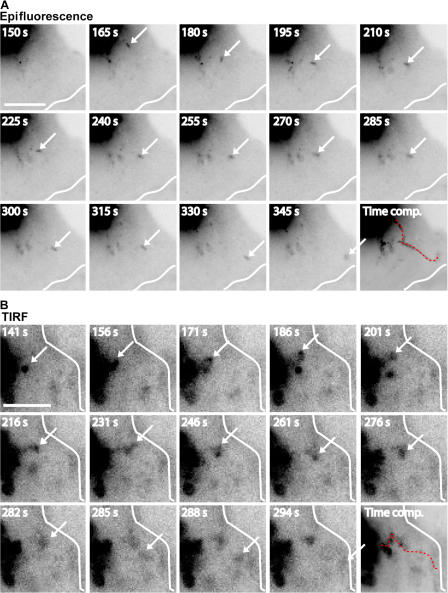
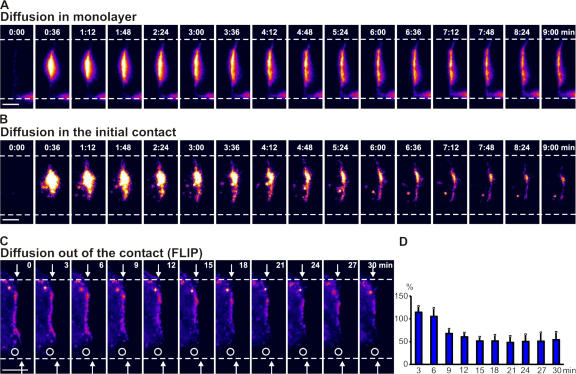
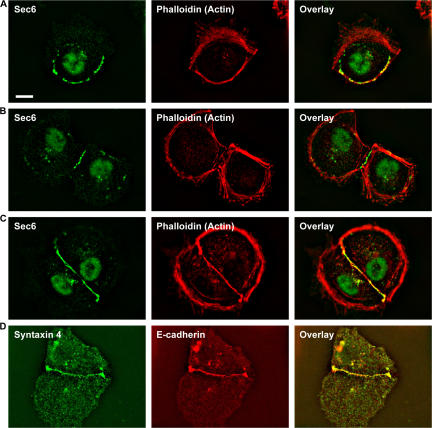
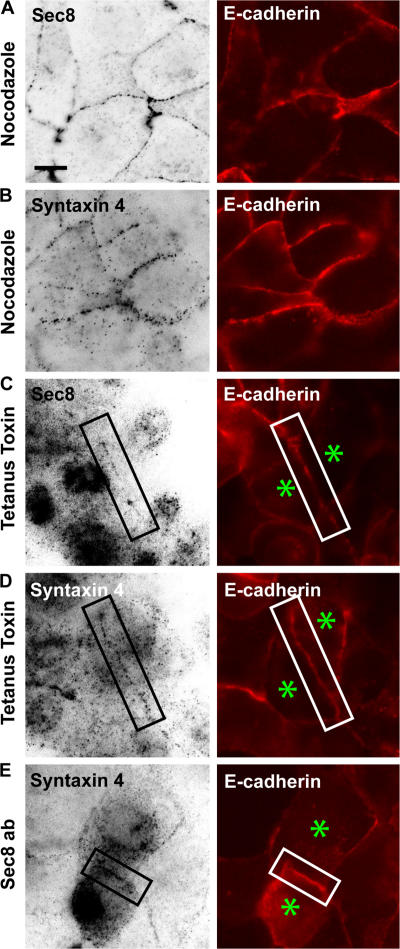
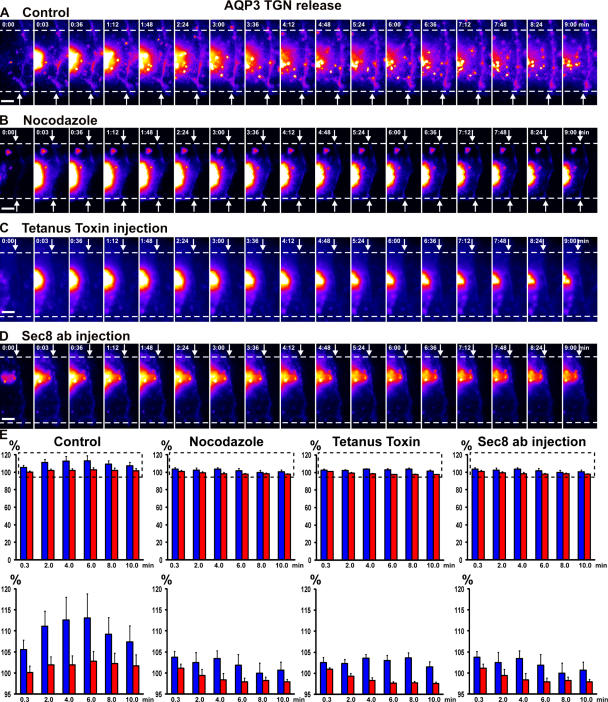
Mechanisms involved in maintaining plasma membrane domains in fully polarized epithelial cells are known, but when and how directed protein sorting and trafficking occur to initiate cell surface polarity are not. We tested whether establishment of the basolateral membrane domain and E-cadherin-mediated epithelial cell-cell adhesion are mechanistically linked. We show that the basolateral membrane aquaporin (AQP)-3, but not the equivalent apical membrane AQP5, is delivered in post-Golgi structures directly to forming cell-cell contacts where it co-accumulates precisely with E-cadherin. Functional disruption of individual components of a putative lateral targeting patch (e.g., microtubules, the exocyst, and soluble N-ethylmaleimide-sensitive factor attachment protein receptors) did not inhibit cell-cell adhesion or colocalization of the other components with E-cadherin, but each blocked AQP3 delivery to forming cell-cell contacts. Thus, components of the lateral targeting patch localize independently of each other to cell-cell contacts but collectively function as a holocomplex to specify basolateral vesicle delivery to nascent cell-cell contacts and immediately initiate cell surface polarity.


Figures

Figure 1.
Figure 1.
AQP3 and AQP5 distributions upon initial cell–cell adhesion. (A) Polarized MDCK cells grown on filters stably expressing AQP3-EGFP and AQP5-EGFP (green) and immunostained for ZO-1 (red). AQP3-EGFP localizes to the basolateral membrane, and AQP5-EGFP localizes to the apical membrane. Bar, 10 μm. (B and C) Representative examples of frames from time-lapse imaging of initial cell–cell adhesion of cells expressing tdRFP- labeled E-cadherin and either EGFP-labeled AQP3 (B) or EGFP-labeled AQP5 (C). Images were captured every minute. E-cadherin–tdRFP accumulates at cell–cell contacts, and AQP3-EGFP coaccumulates with E-cadherin–tdRFP. Some AQP5-EGFP is at the contact at the beginning of cell–cell adhesion, but it disappears from the contact and does not coaccumulate with E-cadherin–tdRFP. Asterisks indicate a single cells. Numbers indicate the time (in minutes) after the start of the time-lapse movie. Bars, 10 μm. (D). Quantitation of AQP3 and AQP5 accumulation at cell–cell contacts. Data points are averages of three independent experiments, and the error bars represent the SEM. Time (in minutes) is depicted on the x axis. (E) E-cadherin–tdRFP–expressing cells forming contacts and immunostained for NaK-ATPase and gp135. The basolateral NaK-ATPase colocalized with E-cadherin at all stages of contact formation. Apical gp135 does not localize to cell–cell contacts. Bar, 5 μm. See Videos 1 and 2, available at http://www.jcb.org/cgi/content/full/jcb.200705094/DC1.
Figure 2.
Figure 2.
AQP3, not AQP5, is delivered from the Golgi to cell–cell contacts. (A and B) Representative example of release from a 19°C block of Golgi- accumulated AQP3-PAGFP (A; see Fig. 7 A) and AQP5-PAGFP (B) in pairs of adhering cells. AQP3-PAGFP rapidly accumulates at cell–cell contacts after photoactivation in the Golgi (A), whereas AQP5-PAGFP does not (B). Arrowheads in A point to the edge of AQP3-PAGFP accumulation, arrows point to the edge of cell–cell contacts, and numbers indicate the time (in minutes) after activation. The fluorescence intensity scale is pseudocolored. Bars, 5 μm. (C and D) Quantitation over time of a small spot of AQP3-PAGFP and AQP5-PAGFP fluorescence at the cell–cell contact proximal to the Golgi (blue, fluorescence intensity at cell–cell contacts; red, fluorescence intensity at the plasma membrane as equidistant from the Golgi as the spot measured at the cell–cell contact). Data points are averages of five independent experiments, and the error bars represent the SEM. The dashed boxes (top) indicate the insets shown (bottom). Quantitation shows that AQP3-PAGFP (C) accumulates at cell–cell contact, whereas AQP5-PAGFP (D) does not. Numbers indicate the time (in minutes) after activation. (E) Quantitation of the increase in AQP3-PAGFP fluorescence at cell–cell contacts relative to fluorescence loss of AQP3-PAGFP from the Golgi after release from a 19°C block. Quantitation shows that 2 min after release, 15% of the loss of AQP3-PAGFP fluorescence from the Golgi accumulates at cell–cell contact. Data points are averages of five independent experiments, and the error bars represent the SEM. Time (in minutes) is depicted on the x axis. See Video 3, available at http://www.jcb.org/cgi/content/full/jcb.200705094/DC1.
Figure 3.
Figure 3.
AQP3-PAGFP post-Golgi carriers traffic to cell–cell contacts. (A and B) Post-Golgi carriers containing AQP3-PAGFP travel from the Golgi to the cell–cell contact (white line) after release from a 19°C block. The carriers (arrows) were followed by epifluorescence (A) and TIRF (B) microscopy. Time-composite images show the trajectories (red dotted lines) of individual carriers from the Golgi to the cell–cell contact. Numbers indicate the time (in seconds) after photoactivation. Bars, 5 μm. See Videos 4–6, available at http://www.jcb.org/cgi/content/full/jcb.200705094/DC1.
Figure 4.
Figure 4.
AQP3-PAGFP diffusion at cell–cell contacts. (A and B) Diffusion of AQP3-PAGFP activated at cell–cell contacts in 24-h monolayers (A) or initial cell pairs (B). Diffusion is very rapid at cell–cell contacts of a cell pair (t1/2 = 19 ± 8 s; B) compared with 24-h monolayers of cells (t1/2 = 143 ± 46 s; A). The fluorescence intensity scale is pseudocolored, and the time is shown (in minutes). Data points are averages of eight independent experiments, and error bars represent the SEM. Bars, 5 μm. (C) FLIP experiment. Continuous photobleaching (open circles) of the plasma membrane adjacent to the cell–cell contact in a pair of cells of which one cell is expressing AQP3-EGFP and the other is a nonexpressing cell. AQP3-EGFP rapidly diffuses out of the contact. Arrows point to the edge of the cell–cell contact. Time is shown (in minutes). The fluorescence intensity scale is pseudocolored. Bar, 10 μm. (D) Quantitation over time of a small spot of AQP3-EGFP at the cell–cell contact adjacent to the site of continuous photobleaching (FLIP) after background subtraction. Data points are averages of three independent experiments, and the error bars represent the SEM. Time (in minutes) is depicted on the x axis.
Figure 5.
Figure 5.
The exocyst and Syntaxin 4 localize to initial cell–cell contacts. (A–C) Alexa Fluor 546–phalloidin stain of actin and immunostain of Sec6 in a single cell (A), and at early (B) and compacted (C) contact between a pair of cells. Sec6 is localized to the cortical actin bundle in single cells, but as cells make early contacts, Sec6 begins to localize to the initial cell–cell contacts (B) and accumulates at cell–cell contacts in compacted cells (C). (D) MDCK cells stably expressing E-cadherin–tdRFP stained with syntaxin 4 antibodies showing that syntaxin 4 colocalized with E-cadherin at cell–cell contacts. Bar, 10 μm.
Figure 6.
Figure 6.
Assembly of the lateral targeting patch at cell–cell contacts. Single MDCK cells stably expressing E-cadherin–tdRFP were seeded in media containing 5 μM Ca2+ to inhibit cell–cell contact formation and were either incubated with nocodazole to depolymerize microtubules or were injected with tetanus toxin or function-blocking Sec8 antibodies. 1.8 mM Ca2+ was added to induce cell–cell contact formation, and cells were processed for immunofluorescence microscopy. (A and B) Cells were treated with nocodazole and immunostained for Sec8 (A) and syntaxin 4 (B). (C and D) Cells injected with tetanus toxin and immunostained for syntaxin 4 (C) and Sec8 (D). (E) Cells injected with Sec8 antibodies and immunostained for syntaxin 4. Cells indicated by asterisks were injected with tetanus toxin (C and D) or function-blocking Sec8 antibodies (E); note that pairs of injected cells were examined. (A–E) E-cadherin localized to cell–cell contacts after calcium readdition, and none of the treatments disrupted Sec8 or syntaxin 4 accumulation at cell–cell contacts. Bar, 10 μm.
Figure 7.
Figure 7.
Delivery of Golgi-accumulated AQP3-PAGFP to cell–cell contacts is blocked in the presence of nocodazole, Sec8 antibodies, or tetanus toxin. (A–D) Representative examples of AQP3-PAGFP released from a 19°C block in the Golgi (control; A), in pairs of adhering cells treated with nocodazole (B), or microinjected with tetanus toxin (C) or Sec8 function-blocking antibodies (D). AQP3-PAGFP only accumulated at cell–cell contact in the control and not after inhibition of any one component of the lateral targeting patch. Arrows point to the edge of contact between two single cells, and numbers indicate the time (in minutes) after activation. The fluorescence intensity scale is pseudocolored. Bars, 5 μm. (E) Quantitation over time of a small spot of AQP3-PAGFP fluorescence at the cell–cell contact proximal to the Golgi. The dashed boxes (top) indicate the insets shown (bottom). Data points are averages of four to five independent experiments, and the error bars represent the SEM (blue, fluorescence intensity at cell–cell contacts; red, fluorescence intensity at the plasma membrane as equidistant from the Golgi as the spot measured at the cell–cell contact). Numbers indicate the time (in minutes) after activation. See Videos 8–10, available at http://www.jcb.org/cgi/content/full/jcb.200705094/DC1.

Similar articles

Cited by

References

    1. Adams, C.L., Y.T. Chen, S.J. Smith, and W.J. Nelson. 1998. Mechanisms of epithelial cell–cell adhesion and cell compaction revealed by high-resolution tracking of E-cadherin–green fluorescent protein. J. Cell Biol. 142:1105–1119. - PMC - PubMed
    1. Ang, A.L., T. Taguchi, S. Francis, H. Folsch, L.J. Murrells, M. Pypaert, G. Warren, and I. Mellman. 2004. Recycling endosomes can serve as intermediates during transport from the Golgi to the plasma membrane of MDCK cells. J. Cell Biol. 167:531–543. - PMC - PubMed
    1. Bacallao, R., C. Antony, C. Dotti, E. Karsenti, E.H. Stelzer, and K. Simons. 1989. The subcellular organization of Madin-Darby canine kidney cells during the formation of a polarized epithelium. J. Cell Biol. 109:2817–2832. - PMC - PubMed
    1. Brunger, A.T. 2005. Structure and function of SNARE and SNARE-interacting proteins. Q. Rev. Biophys. 38:1–47. - PubMed
    1. Chang, J.T., V.R. Palanivel, I. Kinjyo, F. Schambach, A.M. Intlekofer, A. Banerjee, S.A. Longworth, K.E. Vinup, P. Mrass, J. Oliaro, et al. 2007. Asymmetric T lymphocyte division in the initiation of adaptive immune responses. Science. 315:1687–1691. - PubMed

Publication types