. 2007 Aug;130(2):157-68.
doi: 10.1085/jgp.200709818. Epub 2007 Jul 16.

Structural basis of GLUT1 inhibition by cytoplasmic ATP

Affiliations

Structural basis of GLUT1 inhibition by cytoplasmic ATP

David M Blodgett et al. J Gen Physiol. 2007 Aug.

Abstract

Cytoplasmic ATP inhibits human erythrocyte glucose transport protein (GLUT1)-mediated glucose transport in human red blood cells by reducing net glucose transport but not exchange glucose transport (Cloherty, E.K., D.L. Diamond, K.S. Heard, and A. Carruthers. 1996. Biochemistry. 35:13231-13239). We investigated the mechanism of ATP regulation of GLUT1 by identifying GLUT1 domains that undergo significant conformational change upon GLUT1-ATP interaction. ATP (but not GTP) protects GLUT1 against tryptic digestion. Immunoblot analysis indicates that ATP protection extends across multiple GLUT1 domains. Peptide-directed antibody binding to full-length GLUT1 is reduced by ATP at two specific locations: exofacial loop 7-8 and the cytoplasmic C terminus. C-terminal antibody binding to wild-type GLUT1 expressed in HEK cells is inhibited by ATP but binding of the same antibody to a GLUT1-GLUT4 chimera in which loop 6-7 of GLUT1 is substituted with loop 6-7 of GLUT4 is unaffected. ATP reduces GLUT1 lysine covalent modification by sulfo-NHS-LC-biotin by 40%. AMP is without effect on lysine accessibility but antagonizes ATP inhibition of lysine modification. Tandem electrospray ionization mass spectrometry analysis indicates that ATP reduces covalent modification of lysine residues 245, 255, 256, and 477, whereas labeling at lysine residues 225, 229, and 230 is unchanged. Exogenous, intracellular GLUT1 C-terminal peptide mimics ATP modulation of transport whereas C-terminal peptide-directed IgGs inhibit ATP modulation of glucose transport. These findings suggest that transport regulation involves ATP-dependent conformational changes in (or interactions between) the GLUT1 C terminus and the C-terminal half of GLUT1 cytoplasmic loop 6-7.


Figures

Figure 1.
Figure 1.
Kinetics of GLUT1 digestion by trypsin at 37°C. GLUT1 (10 μg) was incubated with trypsin (0.16 μg) ± 4 mM ATP (plus 5 mM MgCl2) for 60 s (A and B) or with 0 ATP, 4 mM ATP, or 4 mM GTP for the times indicated (B). Peptides were separated by SDS-PAGE and the fraction of intact GLUT1 remaining quantitated by densitometry of silver-stained gels. The bars to the left of the gel in A indicate the mobility of molecular weight standards (113, 92, 50.1, 35.4, 29, 21.5 kD from top to bottom). The curves drawn through the data points in B assume two exponential phases of proteolysis. The fast phase accounts for 33 ± 2% of GLUT1 proteolysis and has a first order rate constant of 0.055 ± 0.008 per second (control, •) or 0.049 ± 0.026 per second (GTP, ▵). The slow phase accounts for 66% of GLUT1 digestion and has a first order rate constant of 0.00027 ± 0.00007 per second (control, •) or 0.00026 ± 0.00022 per second (GTP, ▵). ATP (○) reduces the size of the fast phase to 22 ± 2% and slows the fast rate constant to 0.017 ± 0.003 per second. Insufficient data exists to analyze slow phase kinetics in the presence of ATP. Data are shown as mean ± SEM of five separate experiments. (C) ATP protection of GLUT1 during fast phase proteolysis is half-maximal at 627 ± 268 μM ATP. Data are shown as mean ± SEM of 3 separate experiments.
Figure 2.
Figure 2.
Immunoblot analysis of trypsin-digested, purified GLUT1 ± 4 mM ATP. The digest was analyzed by Western blot analysis using a panel of antibodies directed against specific GLUT1 domains: N-Ab (GLUT1 residues 1–13); L6–7-Ab (GLUT1 residues 217–231); L7–8-Ab (GLUT1 residues 299–311); and C-Ab (GLUT1 residues 480–492). (A) Immunoblot analysis of tryptic digests. The key indicates the presence (+) or absence (−) of trypsin (tryp) or ATP (4 mM). The bars to the left of each blot show the mobility of molecular weight standards (kD). The arrows to the right of each blot indicate peptides whose intensity is greater when digests are performed in the presence of ATP. (B) Linear representation of GLUT1. The open boxes show the locations of N-Ab, L6–7-Ab, L7–8-Ab, and C-Ab directed IgG binding domains. The vertical arrows indicate GLUT1 tryptic cleavage sites determined by MS/MS analysis of GLUT1 tryptic digests. The horizontal bars below indicate putative assignments of ATP-sensitive GLUT1 peptides detected by peptide-directed IgGs and their theoretical molecular weight (kD). (C) [ATP] dose response to trypsin digestion. The relative intensities of C-Ab–reactive 20 kD (•) and 25–27 kD (○) peptides increase with [ATP] during proteolysis. Peptide intensity (volume) was quantitated by densitometry of immunoblots using the Image J software package and plotted as a function of [ATP]. Curves were computed by nonlinear regression assuming that intensity increases with [ATP] in a simple, saturable fashion. 20 kD and 25–27 kD peptides are half maximally protected by ATP at (366 ± 202) and (440 ± 211) μM, respectively. This figure represents a single dose–response experiment.
Figure 3.
Figure 3.
Time course of C-Ab binding to ELISA dish–immobilized GLUT1 proteoliposomes (A), red cell membranes (B), HEK cell membranes expressing GLUT (C), and HEK cell membranes expressing the GLUT1–GLUT4 loop 6 chimera in which GLUT1 L6–7 is substituted by GLUT4 L6–7 (D). Ordinate, extent of C-Ab binding (OD415); Abscissa, duration of C-Ab exposure to membranes (min). Filled circles (•) show C-Ab binding in the presence of ATP (4 mM), and open circles (○) show C-Ab binding in the absence of ATP. Results are the mean ± SEM of quadruplicate measurements. Each experiment was repeated three or more times (A–C) or twice (D). Open triangles show C-Ab binding to membranes isolated from untransfected HEK cells. Curves were calculated assuming a single exponential phase of IgG binding described by B (1 − e−kt), where B is equilibrium binding, k is the first order rate constant for binding, and t is time. The results are summarized in Table I. The inset of D shows a C-Ab immunoblot of HEK membranes (20 μg) isolated from untransfected cells (lane 1), cells transfected with wt GLUT1 (lane 3), and cells transfected with the GLUT1–GLUT4 loop 6 chimera (lane 2). The bars to the left of the blot indicate the mobility (top to bottom) of 108-, 90-, and 51-kD molecular weight standards.
Figure 4.
Figure 4.
Analysis of ATP modulation of lysine modification. (A) Time course of GLUT1 labeling by sulfo-NHS-LC-biotin. GLUT1 proteoliposomes were preincubated in buffer lacking (○) or containing 4 mM AMP (•) or 4 mM ATP (▪) before addition of sulfo-NHS-LC-biotin. Ordinate, extent of labeling (measured as OD415); abscissa, time in minutes. Results are shown as mean ± SEM of at least four determinations. Biotinylation kinetics follow pseudo-first order kinetics where labeling equals B0 + B(1 − e−kt). The curves have the following constants: buffer (○), B0 = 0.15 ± 0.02, B = 1.09 ± 0.05, k = 0.0023 ± 0.003 per minute; AMP (•), B0 = 0.16 ± 0.01, B = 1.20 ± 0.03, k = 0.0019 ± 0.0001 per minute; ATP (▪), B0 = 0.098 ± 0.009, B = 0.66 ± 0.02, k = 0.0022 ± 0.0002 per minute. (A, inset) Average B (±SEM) of at least three labeling experiments made in triplicate for control, 4 mM AMP, and 4 mM ATP conditions. (B) Effects of nucleotides on equilibrium GLUT1 biotinylation. Ordinate, extent of total biotin incorporation (shown as mean ± SEM; n = 3 or greater); abscissa, [AMP] or [ATP] (mM) present during labeling. The pseudo-first-order rate constant describing GLUT1 labeling by sulfo-NHS-LC-biotin is unaffected by nucleotides. The extent of labeling is not significantly affected by AMP alone (•). Assuming labeling is described by BC − BN[nucleotide]/(Ki + [nucleotide]), nonlinear regression analysis indicates that for labeling in the presence of ATP (▪), BC = 1.210 ± 0.007, BN = 0.72 ± 0.04, and Ki = 2.1 ± 0.1 mM. ATP inhibition of labeling was also measured in the presence of 2 mM AMP (▵), where BC = 0.9, BN = 0.6, and Ki = 3.8 ± 1.5 mM. AMP therefore anatagonizes ATP modulation of biotinylation with Ki(app) for AMP = 2.2 mM.
Figure 5.
Figure 5.
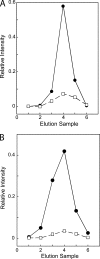
K245 accessibility to biotin labeling is modified by ATP. GLUT1 was labeled to equilibrium by sulfo-NHS-LC-biotin in the presence of 4 mM AMP (A) or ATP (B), trypsin-digested, and soluble peptides examined by RP-HPLC-ESI-MS/MS. Two peptides containing K245 were isolated. The first (m/z = 1444.7 D; sequence R(232).GTADVTHDLQEMK(245).E) was unlabeled and cleaved at K245. The second (m/z = 2285.1 D; R(232).GTADVTHDLQEMKEESR(249).Q) was labeled at K245 (339.2 D adduct covalently attached to K245) and cleaved at R249. Peak areas were calculated for each peptide. (A) Labeling conducted in the presence of 4 mM AMP. Unlabeled peptide area (•) = 5.54 × 10⁸; labeled peptide area (□) = 1.15 × 10⁸; % modified peptide = 17.24%. (B) Labeling conducted in the presence of 4 mM ATP. Unlabeled peptide area (•) = 5.09 × 10⁸, labeled peptide area (□) = 5.73 × 10⁷, % modified peptide = 10.12%. Labeling of K245 is reduced by 41% in the presence of ATP. This is one of three representative experiments. Fig. 6 summarizes the extent of ATP inhibition of labeling of this and three additional peptides.
Figure 6.
Figure 6.
ATP protection of GLUT1 lysine residues. GLUT1 putative membrane-spanning topography (Salas-Burgos et al., 2004) is illustrated. Lysine residues modified by sulfo-NHS-LC-biotin (○) are indicated. This is representative of three separate experiments. Rectangles indicate cytoplasmic regions 1 (K225, K229, and K 230), 2 (K245), 3 (K255 and K 256), and 4 (K477). The extent (%) of ATP protection against lysine modification is indicated as a percentage (mean ± SEM of three separate experiments) adjacent to each region.
Figure 7.
Figure 7.
Model for ATP regulation of GLUT1. GLUT1 putative membrane-spanning topography (Salas-Burgos et al., 2004) is illustrated. The leftmost topography summarizes findings in the presence of AMP. Trypsin cleavage sites (K, ○; R, gray circle), sites of antibody recognition (gray rectangles), and sites where IgG binding is not detected (white rectangles) are indicated. In the presence of ATP (rightmost topography), ATP-sensitive (crosshatched rectangles) and insensitive (gray rectangles) IgG binding domains are indicated. The circles show ATP-insensitive tryptic cleavage sites (○), ATP-protected tryptic cleavage sites (gray circle), and ATP-protected sites of covalent modification by sulfo-NHS-LC-biotin (•). We propose that the GLUT1 C terminus and the C-terminal half of L6–7 respond to ATP binding by undergoing a conformational change that reduces their respective accessibility to polar reagents. This interaction restricts glucose release from the translocation pathway.

Similar articles

Cited by

References

    1. Abramson, J., I. Smirnova, V. Kasho, G. Verner, H.R. Kaback, and S. Iwata. 2003. Structure and mechanism of the lactose permease of Escherichia coli. Science. 301:610–615. - PubMed
    1. Appleman, J.R., and G.E. Lienhard. 1985. Rapid kinetics of the glucose transporter from human erythrocytes. Detection and measurement of a half-turnover of the purified transporter. J. Biol. Chem. 260:4575–4578. - PubMed
    1. Baldwin, S.A., J.M. Baldwin, F.R. Gorga, and G.E. Lienhard. 1979. Purification of the cytochalasin B binding component of the human erythrocyte monosaccharide transport system. Biochim. Biophys. Acta. 552:183–188. - PubMed
    1. Baldwin, S.A., J.M. Baldwin, and G.E. Lienhard. 1982. The monosaccharide transporter of the human erythrocyte. Characterization of an improved preparation. Biochemistry. 21:3836–3842. - PubMed
    1. Blodgett, D.M., and A. Carruthers. 2005. Quench-flow analysis reveals multiple phases of GluT1-mediated sugar transport. Biochemistry. 44:2650–2660. - PubMed

Publication types

MeSH terms