. 2007 Oct;27(19):6718-32.
doi: 10.1128/MCB.00853-07. Epub 2007 Jul 16.

Dephosphorylation and caspase processing generate distinct nuclear pools of histone deacetylase 4

Affiliations

Dephosphorylation and caspase processing generate distinct nuclear pools of histone deacetylase 4

Gabriela Paroni et al. Mol Cell Biol. 2007 Oct.

Abstract

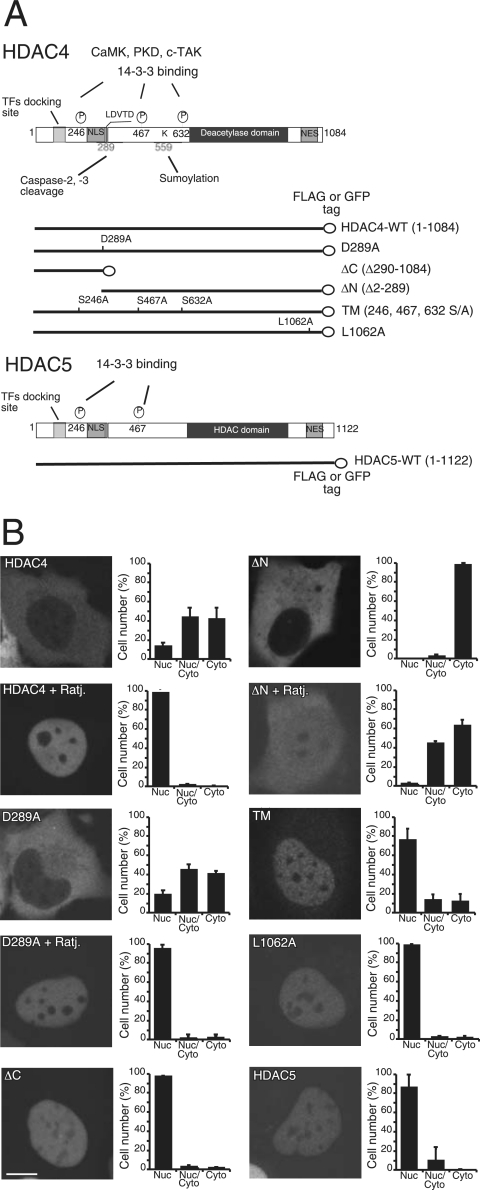
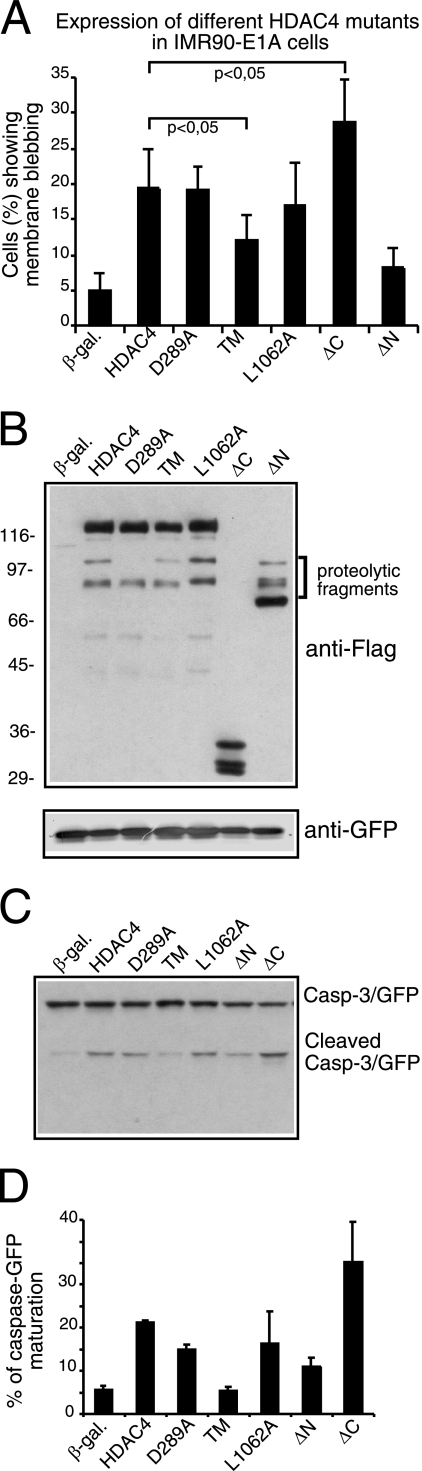
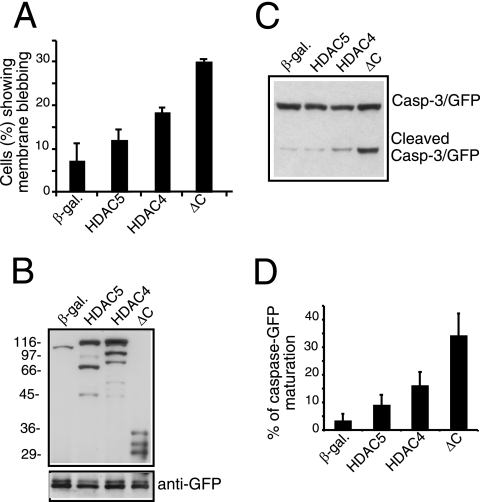
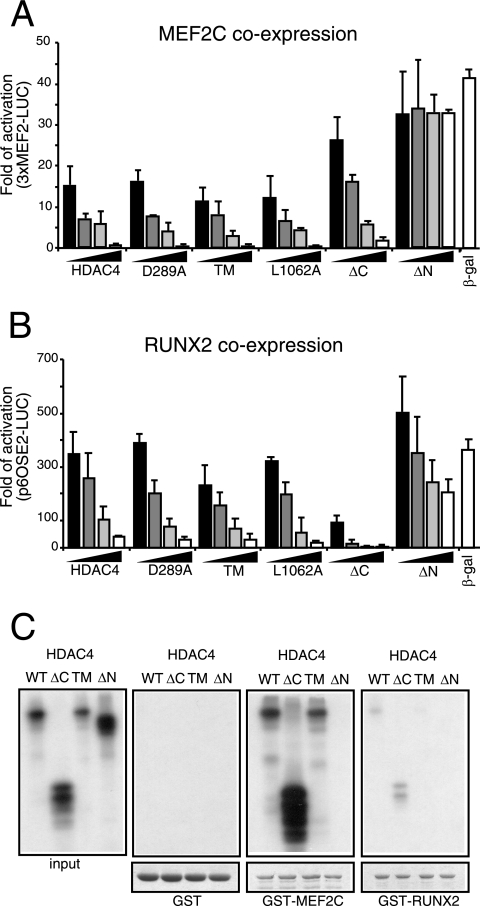
From the nucleus, histone deacetylase 4 (HDAC4) regulates a variety of cellular processes, including growth, differentiation, and survival, by orchestrating transcriptional changes. Extracellular signals control its repressive influence mostly through regulating its nuclear-cytoplasmic shuttling. In particular, specific posttranslational modifications such as phosphorylation and caspase-mediated proteolytic processing operate on HDAC4 to promote its nuclear accumulation or export. To understand the signaling properties of this deacetylase, we investigated its cell death-promoting activity and the transcriptional repression potential of different mutants that accumulate in the nucleus. Here we show that, compared to that of other nuclear forms of HDAC4, a caspase-generated nuclear fragment exhibits a stronger cell death-promoting activity coupled with increased repressive effect on Runx2- or SRF-dependent transcription. However, this mutant displays reduced repressive action on MEF2C-driven transcription. Photobleaching experiments and quantitative analysis of the raw data, based on a two-binding-state compartmental model, demonstrate the existence of two nuclear pools of HDAC4 with different chromatin-binding properties. The caspase-generated fragment is weakly bound to chromatin, whereas an HDAC4 mutant defective in 14-3-3 binding or the wild-type HDAC5 protein forms a more stable complex. The tightly bound species show an impaired ability to induce cell death and repress Runx2- or SRF-dependent transcription less efficiently. We propose that, through specific posttranslation modifications, extracellular signals control two distinct nuclear pools of HDAC4 to differentially dictate cell death and differentiation. These two nuclear pools of HDAC4 are characterized by different repression potentials and divergent dynamics of chromatin interaction.


Figures

FIG. 1.
FIG. 1.
Subcellular localization of HDAC4 and HDAC5 in E1A-transformed IMR90 cells. (A) Schematic representation of HDAC4, HDAC5, and HDAC4 mutants used in this study. Like HDAC5, HDAC4 consists of an N-terminal regulatory region, a catalytic domain (marked “deacetylase”), and a C-terminal NES sequence. Within the N-terminal regulatory region, there are crucial serine residues (i.e., S246, S467, and S632) for phosphorylation and 14-3-3 binding. Also indicated in this region are a transcription factor (TF) docking site, aspartic acid (D) 289 for caspase cleavage, and lysine (K) 559 for sumoylation. (B) Subcellular localization of HDAC4 and HDAC5. Nuclei of E1A-expressing IMR90 cells were microinjected with plasmids expressing HDAC4 or its mutants as GFP fusion proteins, and 2 h later cells were fixed to visualize GFP signals by confocal microscopy. For inhibition of nuclear export, cells were grown for an additional 2 h in the presence of ratjadone A (Ratj.) (5 ng/ml). Approximately 300 cells, derived from three independent experiments, were scored for the quantitative analysis shown in each diagram. Data represent arithmetic means ± standard deviations. PKD, protein kinase D; Nuc, nuclear, cyto, cytosolic.
FIG. 2.
FIG. 2.
Apoptotic activity of HDAC4 mutants. (A) β-Gal, HDAC4, and its mutants were transiently expressed as indicated in IMR90-E1A cells using the vector pFLAG-CMV5 (2 μg each). pEGFP-N1 (0.1 μg) was used as the reporter. Forty-eight hours posttransfection, apoptotic cells were scored based on morphology changes. Cells showing a collapsed shape and presenting extensive membrane blebbing were scored as apoptotic. Data represent arithmetic means ± standard deviations for three independent experiments. (B) β-Gal, HDAC4, and its mutants were expressed as described for panel A. Cell lysates were prepared for immunoblotting with anti-Flag and anti-GFP antibodies as indicated. (C) β-Gal, HDAC4, and its mutants were expressed as described for panel A, except that pEGFP-N1 was replaced with pEGFP-caspase-3 (0.2 μg) to assess caspase-3 processing. Cell lysates were prepared for immunoblotting as described for panel B. (D) Densitometric analysis of immunoblots similar to that shown in panel C. The percentage of caspase-GFP maturation was calculated as the ratio between the proform and the cleaved form of caspase-3. Data represent arithmetic means ± standard deviations for three independent experiments.
FIG. 3.
FIG. 3.
Analysis of the apoptotic activity of HDAC5 in IMR90-E1A cells. (A) Plasmids expressing β-Gal, HDAC5, HDAC4, and the mutant ΔC were derived from pFLAG-CMV5 and were transfected (2 μg each) into IMR90-E1A cells together with pEGFP-N1 (0.1 μg) as a reporter. The appearance of apoptotic cells was scored 48 h after transfection. Cells with a collapsed morphology and extensive membrane blebbing were scored as apoptotic. Data represent arithmetic means ± standard deviations for three independent experiments. (B) Expression constructs for β-Gal, HDAC5, HDAC4, and mutant ΔC (2 μg) were transfected into E1A cells together with pEGFP-N1 (0.1 μg) as a control for transfection efficiency. Cell lysates were prepared for Western immunoblot analysis with anti-FLAG and anti-GFP antibodies. (C) The transfection was performed as described for panel B, except that pEGFP-N1 was replaced with pEGFP-caspase-3 (0.2 μg) to score caspase-3 processing. Cell lysates were prepared and analyzed as described for panel B. (D) Densitometric analysis of the immunoblots shown in panel C. The percentage of caspase-GFP maturation was calculated as the ratio between the proform and the cleaved caspase. Data represent arithmetic means ± standard deviations for three independent experiments.
FIG. 4.
FIG. 4.
Repression of MEF2C- and Runx2-dependent transcription. (A) IMR90-E1A cells were transfected with the 3× MEF2-Luc luciferase reporter (1 μg), the internal control luciferase reporter pRL-CMV (20 ng), pcDNA3.1-HA-MEF2C (1 μg), and increasing amounts (8, 45, 40, and 400 ng) of pFLAG-CMV5 expressing HDAC4 or the indicated mutant. Four hundred nanograms of pFLAG-CMV5 expressing β-Gal was used as a reference, and empty pFLAG-CMV5 was used to normalize the total amount of transfected DNA. Cells were lysed 24 h after transfection. Data represent arithmetic means ± standard deviations for three independent experiments. (B) IMR90-E1A cells were transfected with the 6× OSE2-Luc luciferase reporter (1 μg), pRL-CMV (20 ng), pCMV-Runx2 (1 μg), and increasing amounts (0.12, 0.4, 1.2, and 3.2 μg) of a pFLAG-CMV5-derived vector expressing HDAC4 or the indicated mutant. A volume of 3.2 μg of pFLAG-CMV5 expressing β-Gal was used as a reference, and empty pFLAG-CMV5 was used to normalize the total amount of transfected DNA. Cells were lysed 24 h after transfection. Data represent arithmetic means ± standard deviations for three independent experiments. (C) In vitro binding properties of the different HDAC4 mutants. GST-MEF2C, GST-Runx2, and GST alone (as a control), immobilized on glutathione-Sepharose beads, were incubated with the in vitro-translated products of the indicated HDAC4 constructs. After being washed, proteins bound to the beads were evaluated by SDS-PAGE.
FIG. 5.
FIG. 5.
Repression of SRF-dependent transcription. (A) Schematic representation of the Bcl-2 promoter and of the fragments used in this study. Arrows depict the transcription starting sites from the P1 and P2 promoters. The binding sites for SRF and some regulatory elements are shown. (B) IMR90-E1A cells were transfected with the LB124, LB335, or LB332 reporter (1 μg) and a pFLAG-CMV5-derived β-Gal expression plasmid (0.4 μg) or a pFLAG-CMV5-based vector expressing HDAC4. A pCGN vector expressing the wt form of SRF (SRF-WT) (1 μg) or its deleted derivative lacking the transactivation domain (SRF-DN) (1 μg) also was cotransfected. pRL-CMV (20 ng) was included to normalize the transfection efficiency. Data represent arithmetic means ± standard deviations for three independent experiments. (C) IMR90-E1A cells were transfected with the LB335-Luc reporter (1 μg), pRL-CMV (20 ng), pCGN-SRF-WT (1 μg), and increasing amounts (0.2, 0.4, 0.8, and 1.6 μg) of a pFLAG-CMV5-based vector expressing HDAC4 and the indicated mutants. A volume of 1.6 μg of pFLAG-CMV5 expressing β-Gal was used as a reference, and empty pFLAG-CMV5 was used to normalize the total amount of transfected DNA. Cells were lysed 24 h after transfection. Data represent arithmetic means ± standard deviations for three independent experiments. (D) In vitro binding properties of the different HDAC4 mutants. GST-SRF and GST alone (as a control), immobilized on glutathione-Sepharose beads, were incubated with the in vitro-translated products of the indicated HDAC4 constructs. After being washed, proteins bound to the beads were evaluated by SDS-PAGE. (E) IMR90-E1A cells were transfected with the LB335-Luc reporter (1 μg); pRL-CMV (20 ng); a pEXV-derived vector for RhoA-V14, RhoA-Rac1-N17, or β-Gal (3 μg each); and a pFLAG-CMV5 plasmid for expression of the HDAC4 mutant ΔC (100 or 400 ng). pFLAG-CMV5 was used to normalize the total amount of transfected DNA. Cells were lysed 24 h after transfection. Data are shown as fold activation with respect to Rac1-N17-expressing cells. Data represent arithmetic means ± standard deviations for three independent experiments. (F) Regulation of bcl-2 mRNA expression by HDAC4/ΔC. Quantitative RT-PCR analysis was performed to quantify bcl-2 mRNAs. pFLAG-CMV expression plasmids encoding the indicated proteins were transfected in E1A cells, and mRNA was isolated 24 h later. Samples were normalized to GAPDH and hypoxanthine phosphoribosyltransferase. Values represent the means from four independent experiments ± standard deviations. (G) pFLAG-CMV5-HDAC4 (2 μg) was cotransfected into IMR90-E1A cells together with pFLAGCMV5-β-Gal, pGDSV7S-Bcl-2, and a pUSE vector expressing the myristylated constitutively active form (A-Akt) or the K179M inactive form (I-Akt) of Akt1, as indicated. pEGFP-N1 (0.1 μg) was used as the reporter. The appearance of apoptotic cells was scored 48 h after transfection. Cells showing a collapsed morphology and with extensive membrane blebbing were scored as apoptotic. Data represent arithmetic means ± standard deviations for three independent experiments.
FIG. 6.
FIG. 6.
Determination of HDAC4 trafficking by FRAP analysis. (A and B) Subcellular localization of HDAC4 in U2OS and IMR90-E1A cells. IMR90-E1A (A) or U2OS (B) cells received nuclear microinjections with plasmid encoding GFP-HDAC4, and 2 h later cells were fixed for microscopic analysis. Subcellular localization of GFP fusion proteins was visualized by confocal microscopy. For inhibition of nuclear export, cells were grown for 2 h in the presence of ratjadone A (5 ng/ml). Approximately 300 cells, from three independent experiments, were scored for the quantitative analysis reported in the diagrams. Data represent arithmetic means ± standard deviations. (C and D) FRAP analysis was performed on IMR90-E1A (C) or U2OS cells (D) expressing GFP, NLS-GFP, or GFP-HDAC4. FRAP on HDAC4 was carried out in the presence or absence of ratjadone A (Ratj) (5 ng/ml). The recovery profiles represent the average profiles of individually photobleached cells, as indicated. The intracellular distribution of different GFP fusion proteins is shown in the upper part. Nuc, nuclear; Cyto, cytoplasmic.
FIG. 7.
FIG. 7.
FRAP analysis of different nuclear proteins. (A and B) FRAP analysis was performed with IMR90-E1A (A) or U2OS (B) cells expressing GFP-HDAC4, GFP-MEF2C, or GFP-H1.2. FRAP on GFP-HDAC4 was carried out in the presence or absence of ratjadone A (Ratj) (5 ng/ml). The recovery profiles represent the average profiles of individually photobleached cells, as indicated. The distribution of the different GFP fusion proteins is shown in the upper part. (C and D) FRAP analysis was performed with IMR90-E1A (C) or U2OS (D) cells expressing GFP fused with HDAC4, HDAC5, and HDAC4 mutants ΔC, L1062A, and TM. FRAP on HDAC4 was carried out in the presence of ratjadone A (5 ng/ml). The recovery profiles represent the average profiles of individually photobleached cells, as indicated. The distribution of the different GFP proteins is shown in the upper part.
FIG. 8.
FIG. 8.
Illustration of two different modes of HDAC4 regulation by nucleocytoplasmic shuttling. Specific phosphorylation of HDAC4 by kinases such as CaMKs, PKDs, and c-TAK promotes the binding to 14-3-3 proteins and cytoplasmic localization. Dephosphorylation then promotes nuclear localization (mode 1). HDAC4 also is subject to caspase cleavage, and the N-terminal fragment then translocates to the nucleus for transcriptional repression (mode 2). While mode 1 is reversible, mode 2 is irreversible. Mode 2 may operate during apoptosis, and mode 1 may be important for controlling cell differentiation or other cellular programs. PKD, protein kinase D.

Similar articles

Cited by

References

    1. Backs, J., K. Song, S. Bezprozvannaya, S. Chang, and E. N. Olson. 2006. CaM kinase II selectively signals to histone deacetylase 4 during cardiomyocyte hypertrophy. J. Clin. Investig. 116:1853-1864. - PMC - PubMed
    1. Bellido, T., A. A. Ali, L. I. Plotkin, Q. Fu, I. Gubrij, P. K. Roberson, R. S. Weinstein, C. A. O'Brien, S. C. Manolagas, and R. L. Jilka. 2003. Proteasomal degradation of Runx2 shortens parathyroid hormone-induced anti-apoptotic signaling in osteoblasts. A putative explanation for why intermittent administration is needed for bone anabolism. J. Biol. Chem. 278:50259-50272. - PubMed
    1. Blyth, K., F. Vaillant, L. Hanlon, N. Mackay, M. Bell, A. Jenkins, J. C. Neil, and E. R. Cameron. 2006. Runx2 and MYC collaborate in lymphoma development by suppressing apoptotic and growth arrest pathways in vivo. Cancer Res. 66:2195-2201. - PubMed
    1. Bolger, T. A., and T. P. Yao. 2005. Intracellular trafficking of histone deacetylase 4 regulates neuronal cell death. J. Neurosci. 25:9544-9553. - PMC - PubMed
    1. Borghi, S., S. Molinari, G. Razzini, F. Parise, R. Battini, and S. Ferrari. 2001. The nuclear localization domain of the MEF2 family of transcription factors shows member-specific features and mediates the nuclear import of histone deacetylase 4. J. Cell Sci. 114:4477-4483. - PubMed

Publication types

MeSH terms

LinkOut - more resources