Comparative Study
. 2007 Sep;27(18):6396-406.
doi: 10.1128/MCB.00719-07. Epub 2007 Jul 16.

Replication in hydroxyurea: it's a matter of time

Affiliations
Comparative Study

Replication in hydroxyurea: it's a matter of time

Gina M Alvino et al. Mol Cell Biol. 2007 Sep.

Abstract

Hydroxyurea (HU) is a DNA replication inhibitor that negatively affects both the elongation and initiation phases of replication and triggers the "intra-S phase checkpoint." Previous work with budding yeast has shown that, during a short exposure to HU, MEC1/RAD53 prevent initiation at some late S phase origins. In this study, we have performed microarray experiments to follow the fate of all origins over an extended exposure to HU. We show that the genome-wide progression of DNA synthesis, including origin activation, follows the same pattern in the presence of HU as in its absence, although the time frames are very different. We find no evidence for a specific effect that excludes initiation from late origins. Rather, HU causes S phase to proceed in slow motion; all temporal classes of origins are affected, but the order in which they become active is maintained. We propose a revised model for the checkpoint response to HU that accounts for the continued but slowed pace of the temporal program of origin activation.


Figures
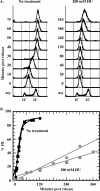
FIG. 1.
FIG. 1.
HU dramatically slows S phase progression and DNA synthesis. Cells grown at 23°C in isotopically dense (13C, 15N) medium were synchronized by incubation with alpha mating pheromone. The cells were then filtered, resuspended in yeast complete (12C, 14N) medium and incubated for ∼2 h at 37°C (the restrictive temperature for cdc7-1) with or without addition of HU. When 93% of the cells were budded, the culture was returned to 23°C to allow entry into S phase, and samples were collected periodically. (A) S phase progression in the absence (left) or presence (right) of 200 mM HU as measured by flow cytometry following staining with Sytox green. asy, asynchronous culture; 0 min, point at which cells were transferred back to 23°C. (B) DNA synthesis was quantified from the fractionated CsCl gradient samples by hybridizing slot blots with a probe made from total genomic DNA. The %HL at each sample time reveals the kinetics of genomic DNA synthesis from two independent collections (see text for details). Black symbols represent untreated samples; gray symbols represent HU-treated samples.
FIG. 2.
FIG. 2.
Models for origin activation and S-phase progression in the presence of HU. Diagrams depict %HL replication profiles predicted for two different models. The filled arrows indicate positions of an early and a late origin. (A) Repression of late origin firing. The current intra-S phase replication checkpoint model predicts that early origins are activated while late origins are specifically inactivated. As S phase proceeds, late origins would eventually be replicated passively by slowly moving forks that emanated from early-firing origins. (B) Slowing of the S phase clock. The temporal program of origin activation is slow but intact. There is no specific repression of just late origins. As S phase begins, early origins are activated. Additional origins become active throughout S phase and are visualized by new zones of expanding synthesis. Note that the models are indistinguishable early in S phase (i.e., at low levels of net DNA synthesis).
FIG. 3.
FIG. 3.
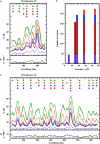
Replication dynamics in the absence of HU. (A and C) Replication profiles for chromosomes VI and XI, respectively. Cells were grown and S phase samples were collected as described for Fig. 1. HH and HL DNAs from each timed sample were differentially labeled and cohybridized to microarray slides. The bottom panels show the accumulation of HL DNA at 10 (purple), 12.5 (red), 15 (blue), 17.5 (gold), and 25 (green) minutes postrelease plotted against chromosomal coordinate. Like colors indicate dye swaps, the yellow circle identifies the centromere. The top panels indicate the sample time(s) and locations at which origin activity (peaks in the chromosome profiles) was detected. See text for details on peak detection. (B and D) Control for HH contamination of HL DNA. DNA from logarithmically growing cells was subjected to centrifugation in a CsCl gradient. The “lightest” 4.5% of the DNA (analogous to HL DNA) was pooled separately from the remaining DNA. The DNAs were differentially labeled and cohybridized to a microarray. The data (%“HL,” i.e., percentage of DNA present in the lighter pool) were plotted against chromosomal coordinates. This profile reveals those HH regions of the genome that are likely to contaminate the HL region of a gradient from density transfer samples. These data were also used to generate a baseline for identifying significant maxima in the density transfer experiment. See text for details. (E) Cumulative origin count during S phase plotted as a function of the percentage of the genome that is hybrid in density. The data are summed from the genome-wide profiles found in Fig. S1 and Table S1 in the supplemental material, with each origin color coded to identify the time at which activation of the origin was first identified in a significant fraction of cells in the culture.
FIG. 4.
FIG. 4.
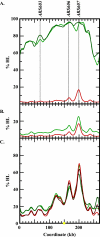
Comparison of HU-treated and untreated samples. One-half of the synchronous culture used to generate the replication profiles in Fig. 3 and Fig. S1 in the supplemental material was treated with 200 mM HU and released into S phase as described in the text. Culture samples were collected periodically for 300 min, and the DNA was separated into HH and HL fractions in CsCl gradients. Replication profiles were generated as described for Fig. 3. (A) Chromosome VI replication profiles from HU-treated (red) and untreated (green) samples at the same absolute time in S phase (40 min after return to 23°C). (B and C) Chromosome VI replication profiles from HU-treated and untreated samples at times in S phase when the percent HL values of genomic DNA for untreated and treated sample were similar. (B) The 40-min HU-treated sample (red; 3.2%HL) is plotted with the 10-min untreated sample (green; 5.2%HL). (C) The 120-min HU-treated sample (red; 17.2%HL) is plotted with the 15-min untreated sample (green; 17.2% HL). See materials and methods in the supplemental material for statistical analysis used to compare the panel C samples.
FIG. 5.
FIG. 5.
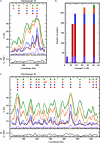
Replication dynamics in the presence of HU. (A and C) Replication profiles for chromosomes VI and XI, respectively. The synchronous culture was treated with HU as described for Fig. 4 and in the text. Chromosome profiles and significant origin peaks were identified as described for Fig. 3 and in the text. The bottom panels show the accumulation of HL DNA at 40 (purple), 80 (red), 120 (blue), 240 (gold), and 300 (green) minutes postrelease plotted against the chromosomal coordinate. The yellow circle identifies the centromere. The top panels indicate the sample time(s) at which replication origins (peaks in the chromosome profile) are active. (B and D) Control experiment as described for Fig. 3. (E) Cumulative origin count during S phase is plotted as a function of the percentage of the genome that is hybrid in density. See the Fig. 3 legend for details.
FIG. 6.
FIG. 6.
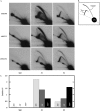
2D agarose gel analysis of origin activity in the presence of 200 mM HU. (A) Cells were grown in complete medium and synchronized with alpha mating pheromone followed by incubation at 37°C, the restrictive temperature for cdc7-1. Cells were allowed to enter S phase in the presence of 200 mM HU. Equal culture volumes were collected at designated intervals to create two pooled samples for 2D gel analysis. Pool S1 consisted of samples taken every 10 min from 10 to 90 min, inclusive. Pool S2 consisted of samples collected every 30 min from 120 to 360 min, inclusive. Tp0 refers to control cells harvested before release into S phase. High-molecular-weight DNA was isolated from each pool, digested with EcoRV, and subjected to electrophoresis in two dimensions (16). A Southern blot was probed sequentially to reveal replication bubbles at three different origins. Autoradiographs reveal replication intermediates at an early origin, ARS305 (Trep = 12.6 min), a mid-S origin, ARS511 (Trep = 18.7 min), and a late origin, ARS1414 (Trep = 24.7 min). (B) Cartoon illustrating the structures visualized by 2D gel electrophoresis. (C) Abundance of the bubble intermediates relative to the 1N spot of linear DNA for the three origins: ARS305 (light gray), ARS511 (medium gray), and ARS1414 (black).
FIG. 7.
FIG. 7.
Model for checkpoint-mediated modulation of the S phase clock. HU prevents the expansion of dNTP pools that would normally occur as cells enter S phase. As a result, cells entering S phase in the presence of HU show reduced fork migration rates and increased regions of ssDNA at the forks, eliciting the S phase checkpoint and the phosphorylation of Rad53 (34). Activated Rad53 in turn phosphorylates several proteins including Dbf4, the regulatory partner that together with Cdc7 comprises the DDK, the essential kinase needed at every origin for activation. The phosphorylated Dbf4 dissociates from Cdc7 (11, 12), and the resulting drop in the concentration of active DDK decreases the probability of origin activations, thereby stretching the program of origin activation.

References

    1. Alcasabas, A. A., A. J. Osborn, J. Bachant, F. Hu, P. J. Werler, K. Bousset, K. Furuya, J. F. Diffley, A. M. Carr, and S. J. Elledge. 2001. Mrc1 transduces signals of DNA replication stress to activate Rad53. Nat. Cell Biol. 3:958-965. - PubMed
    1. Allen, J. B., Z. Zhou, W. Siede, E. C. Friedberg, and S. J. Elledge. 1994. The SAD1/RAD53 protein kinase controls multiple checkpoints and DNA damage-induced transcription in yeast. Genes Dev. 8:2401-2415. - PubMed
    1. Aparicio, O. M., A. M. Stout, and S. P. Bell. 1999. Differential assembly of Cdc45p and DNA polymerases at early and late origins of DNA replication. Proc. Natl. Acad. Sci. USA 96:9130-9135. - PMC - PubMed
    1. Aparicio, O. M., D. M. Weinstein, and S. P. Bell. 1997. Components and dynamics of DNA replication complexes in S. cerevisiae: redistribution of MCM proteins and Cdc45p during S phase. Cell 91:59-69. - PubMed
    1. Bousset, K., and J. F. Diffley. 1998. The Cdc7 protein kinase is required for origin firing during S phase. Genes Dev. 12:480-490. - PMC - PubMed

Publication types

MeSH terms