

Transcriptional oncogenomic hot spots in Barrett's adenocarcinomas: serial analysis of gene expression
- PMID: 17636545
- PMCID: PMC7165894
- DOI: 10.1002/gcc.20479
Transcriptional oncogenomic hot spots in Barrett's adenocarcinomas: serial analysis of gene expression
Abstract
Serial analysis of gene expression (SAGE) provides quantitative and comprehensive expression profiling in a given cell population. In our efforts to define gene expression alterations in Barrett's-related adenocarcinomas (BA), we produced eight SAGE libraries and obtained a total of 457,894 expressed tags with 32,035 (6.9%) accounting for singleton tags. The tumor samples produced an average of 71,804 tags per library, whereas normal samples produced an average of 42,669 tags per library. Our libraries contained 67,200 unique tags representing 16,040 known gene symbols. Five hundred and sixty-eight unique tags were differentially expressed between BAs and normal tissue samples (at least twofold; P<or=0.05), 395 of these matched to known genes. Interestingly, the distribution of altered genes was not uniform across the human genome. Overexpressed genes tended to cluster in well-defined hot spots located in certain chromosomes. For example, chromosome 19 had 26 overexpressed genes, of which 18 mapped to 19q13. Using the gene ontology approach for functional classification of genes, we identified several groups that are relevant to carcinogenesis. We validated the SAGE results of five representative genes (ANPEP, ECGF1, PP1201, EIF5A1, and GKN1) using quantitative real-time reverse-transcription PCR on 31 BA samples and 26 normal samples. In addition, we performed an immunohistochemistry analysis for ANPEP, which demonstrated overexpression of ANPEP in 6/7 (86%) Barrett's dysplasias and 35/65 (54%) BAs. ANPEP is a secreted protein that may have diagnostic and/or prognostic significance for Barrett's progression. The use of genomic approaches in this study provided useful information about the molecular pathobiology of BAs.
Copyright (c) 2007 Wiley-Liss, Inc.
Figures

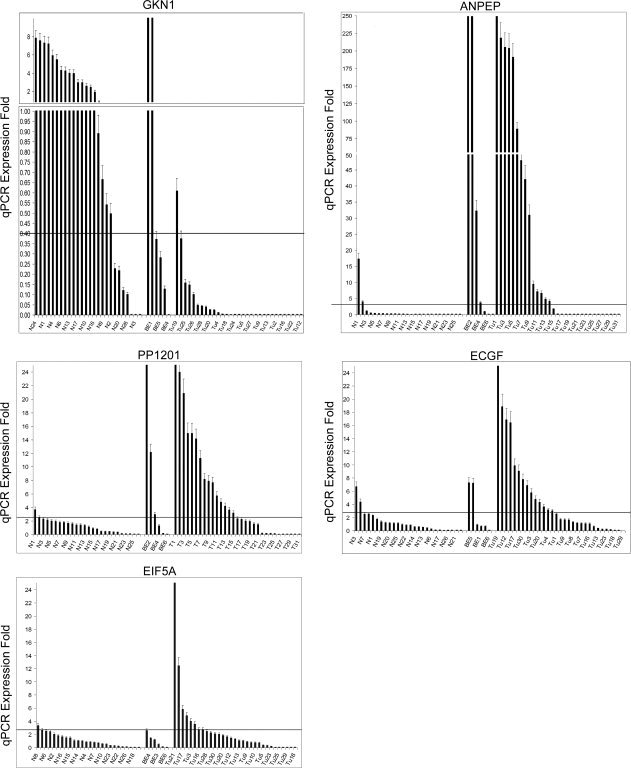
 as detailed in the “Materials and Methods” section. Each bar represents one sample. The displayed mean fold expression for each sample is calculated in comparison with the expression average of the 26 normal samples. The expression of each gene was normalized to the expression of HPRT1, which showed minimal variation in all normal and neoplastic samples tested. GKN1 shows downregulation (≤0.4‐fold expression) whereas ANPEP, PP1201, EIF5A1, and ECGF1 demonstrate overexpression (≥2.5 fold expression) in primary tumors as compared to normal tissue samples.
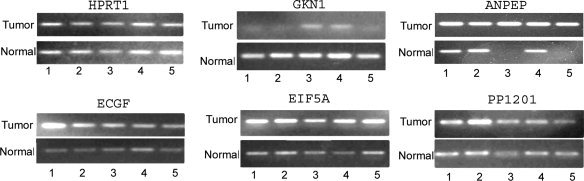

References
-
- Argani P,Rosty C,Reiter RE,Wilentz RE,Murugesan SR,Leach SD,Ryu B,Skinner HG,Goggins M,Jaffee EM,Yeo CJ,Cameron JL,Kern SE,Hruban RH. 2001. Discovery of new markers of cancer through serial analysis of gene expression: Prostate stem cell antigen is overexpressed in pancreatic adenocarcinoma. Cancer Res 61: 4320–4324. - PubMed
-
- Ashburner M,Ball CA,Blake JA,Botstein D,Butler H,Cherry JM,Davis AP,Dolinski K,Dwight SS,Eppig JT,Harris MA,Hill DP,Issel‐Tarver L,Kasarskis A,Lewis S,Matese JC,Richardson JE,Ringwald M,Rubin GM,Sherlock G. 2000. Gene ontology: Tool for the unification of biology. The Gene Ontology Consortium. Nat Genet 25: 25–29. - PMC - PubMed
-
- Bakkenist CJ,Kastan MB. 2004. Phosphatases join kinases in DNA‐damage response pathways. Trends Cell Biol 14: 339–341. - PubMed
-
- Belkhiri A,Zaika A,Pidkovka N,Knuutila S,Moskaluk C,El‐Rifai W. 2005. Darpp‐32: A novel antiapoptotic gene in upper gastrointestinal carcinomas. Cancer Res 65: 6583–6592. - PubMed
-
- Benjamini Y,Drai D,Elmer G,Kafkafi N,Golani I. 2001. Controlling the false discovery rate in behavior genetics research. Behav Brain Res 125: 279–284. - PubMed
Publication types
MeSH terms
Substances
Grants and funding
LinkOut - more resources
Full Text Sources
Miscellaneous
