Comparative Study
. 2008 Aug;29(8):958-72.
doi: 10.1002/hbm.20440.

Test-retest and between-site reliability in a multicenter fMRI study

Affiliations
Comparative Study

Test-retest and between-site reliability in a multicenter fMRI study

Lee Friedman et al. Hum Brain Mapp. 2008 Aug.

Abstract

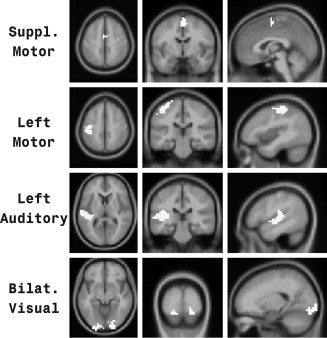
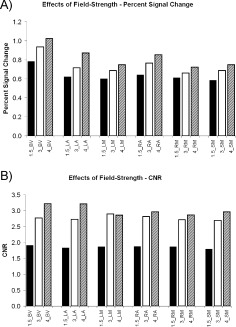
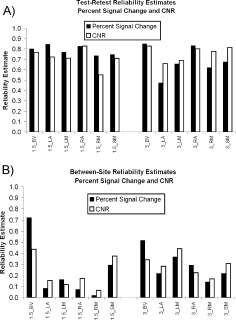
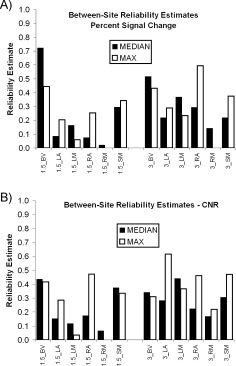
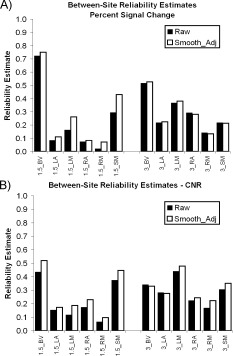
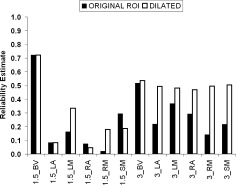
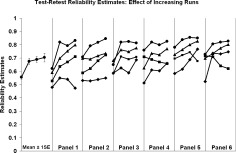
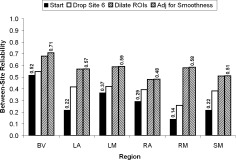
In the present report, estimates of test-retest and between-site reliability of fMRI assessments were produced in the context of a multicenter fMRI reliability study (FBIRN Phase 1, www.nbirn.net). Five subjects were scanned on 10 MRI scanners on two occasions. The fMRI task was a simple block design sensorimotor task. The impulse response functions to the stimulation block were derived using an FIR-deconvolution analysis with FMRISTAT. Six functionally-derived ROIs covering the visual, auditory and motor cortices, created from a prior analysis, were used. Two dependent variables were compared: percent signal change and contrast-to-noise-ratio. Reliability was assessed with intraclass correlation coefficients derived from a variance components analysis. Test-retest reliability was high, but initially, between-site reliability was low, indicating a strong contribution from site and site-by-subject variance. However, a number of factors that can markedly improve between-site reliability were uncovered, including increasing the size of the ROIs, adjusting for smoothness differences, and inclusion of additional runs. By employing multiple steps, between-site reliability for 3T scanners was increased by 123%. Dropping one site at a time and assessing reliability can be a useful method of assessing the sensitivity of the results to particular sites. These findings should provide guidance toothers on the best practices for future multicenter studies.


Figures

Figure 1
Figure 1
ROIs. Four of six ROIs employed in this study. ROIs are shown in white. For each ROI, an axial, coronal, and sagittal view is presented. The remaining two ROIs (right motor and right auditory) were comparable to the contralateral ROIs shown in this figure.
Figure 2
Figure 2
Field strength effects. (A) Mean PSC estimates (based on median ROI extraction) for 1.5T, 3T, and the 4T scanner across six ROIs (BV= bilateral visual cortex, LA = left auditory cortex, LM = left motor cortex, RA = right auditory cortex, RM = right motor cortex and SM = supplementary motor cortex). (B) Mean CNR estimates (based on median ROI extraction) for 1.5T, 3T, and the 4T scanner across six ROIs.
Figure 3
Figure 3
Reliability. (A) Test–retest reliability estimates for PSC and CNR for 1.5T and 3T scanners at six ROIs. See Figure 2 for ROI definitions. (B) Between‐site reliability estimates for PSC and CNR for 1.5T and 3T scanners at six ROIs.
Figure 4
Figure 4
Comparing the median and the maximum. (A) Between‐site reliability estimates for PSC based on either median ROI extraction or maximum ROI extraction for 1.5T and 3T scanners at six ROIs. See Figure 2 for ROI definitions. (B) Between‐site reliability estimates for CNR based on either median ROI extraction or maximum ROI extraction for 1.5T and 3T scanners at six ROIs.
Figure 5
Figure 5
Effects of controlling for smoothness. (A) The effect of prior adjustment for smoothness on between‐site reliability of median PSC at 1.5T and 3T for six ROIs. See Figure 2 for ROI definitions. (B) The effect of prior adjustment for smoothness on between‐site reliability of median CNR at 1.5T and 3T for six ROIs.
Figure 6
Figure 6
Effect of dilating ROIs. Between‐site ICCs for median PSC with and without ROI dilation. Note the improved reliability with dilated ROIs especially at 3T.
Figure 7
Figure 7
Effect of increasing number of runs. Relationship between number of runs contributing to the average estimate (abscissa) and test–retest ICC for 24 measures [two measurement PSC vs. CNR), six ROIs, and two field strengths). In the most panel, the predicted means and standard errors are plotted from a repeated measures polynomial contrast model. The curves are spread across six panels to enhance visibility of curve. The source of the data in each curve is not identified the figure.
Figure 8
Figure 8
Concatenating steps to improve reliability. Effect of a series of steps, described in the text, on between‐site reliability for median PSC from 3T scanners.

Similar articles

Cited by

References

    1. Aron AR, Gluck MA, Poldrack RA ( 2006): Long‐term test‐retest reliability of functional MRI in a classification learning task. Neuroimage 29: 1000–1006. - PMC - PubMed
    1. Benjamini Y, Hochberg Y ( 1995): Controlling the false discovery rate: A practical and powerful approach to multiple testing. J R Stat Soc B 57: 289–300.
    1. Charter RA ( 1999): Sample size requirements for precise estimates of reliability, generalizability, and validity coefficients. J Clin Exp Neuropsychol 21: 559–566. - PubMed
    1. Cicchetti DV ( 2001): The precision of reliability and validity estimates re‐visited: Distinguishing between clinical and statistical significance of sample size requirements. J Clin Exp Neuropsychol 23: 695–700. - PubMed
    1. Cicchetti DV, Sparrow SA ( 1981): Developing criteria for establishing interrater reliability of specific items: Applications to assessment of adaptive behavior. Am J Ment Defic 86: 127–137. - PubMed

Publication types