Review
. 2007 Aug;107(8):3467-97.
doi: 10.1021/cr068309+. Epub 2007 Jul 18.

Comparative genomic reconstruction of transcriptional regulatory networks in bacteria

Affiliations
Review

Comparative genomic reconstruction of transcriptional regulatory networks in bacteria

Dmitry A Rodionov. Chem Rev. 2007 Aug.
No abstract available


Figures

Figure 1
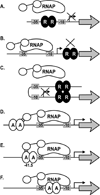
Figure 1. Mechanisms of regulation by transcription factors in prokaryotes
A, repression by steric hindrance; B, repression by blocking of the transcription elongation; C, repression by DNA looping; D, Class I activation; E, Class II activation; F, activation by conformation change. ‘RNAP’, ‘A’, and ‘R’ indicate RNA polymerase, activator and repressor proteins, respectively. Promoter elements are shown by ‘−35’ and ‘−10’ boxes. Thin and thick arrows indicate transcription start sites and target genes, respectively. At Class I promoters, the activator is bound to an upstream site and contacts α subunit of RNAP, thereby recruiting the polymerase to the promoter. At Class II promoters, the activator binds to a target that is adjacent to promoter (in most cases at position −41.5 relative to transcription start site), and the bound activator interacts with σ70 subunit of RNAP.
Figure 2
Figure 2. Representation of transcription factor binding sites
A, Alignment of NagC binding sites in E. coli and the derived consensus sequence. B. Sequence logo representation generated by the WebLogo tool (http://weblogo.berkeley.edu). The relative height of letters represents the frequencies of nucleotides at each position measured in bits of information. C. PWM for the NagC binding motif, where the repective positional weights were calculated using the following formula: Wb,k = log (Nb,k + 0.5) − 0.25 Σi=A,T,G,C log (Ni,k + 0.5), where Nb,k is the count of nucleotide b in position k.
Figure 3
Figure 3. Number of TFs in prokaryotic genomes against the total number of ORFs per genome
Predicted TFs are from DBD database. Different taxonomic groups listed in the right insert are represented by dots of different form and color. Number of genomes in each taxonomic group is given in parenthesis. A. Plot for 205 prokaryotic genomes with size more than 1500 ORFs. B. Plot for 29 genomes of obligate pathogens and symbionts with size less than 1500 ORFs.
Figure 4
Figure 4. Comparative genomic approaches for TFBSs identification
A. Consistency check of the candidate TFBSs in a group of genomes. First, all UTRs in the genomes are scanned by the constructed PWM to identify candidate TFBSs. Then, the predicted TFBSs are differentiated based on their conservation in other genomes. False positive sites usually are not conserved in related genomes with orthologous TFs. Accounting for changes in operon structure in different genomes (gene loss, split and fusion of operons) increases the rate of predicted true positive sites. B. Phylogentic footprinting of orthologous UTRs on the example of the nrdA gene in Pseudomonas species. Highly conserved DNA regions that correspond to the NrdR-binding site, candidate −35 and −10 promoter elements, and the ribosomal binding site are shown by thick lines.
Figure 5
Figure 5. Schematic representation of two strategies for comparative genomic reconstruction of regulons
A. Strategy I for analysis of known regulons with experimentally determined TFs. Known TFBSs are collected to construct a PWM, which is used to scan the genomes for additional sites. If TFBS model is unknown, the set of upstream regions of known TF-regulated genes and their orthologs in other genomes is collected and used as an input for TFBS pattern recognition programs and a PWM construction. B. Strategy II for discovery of novel regulons operating by previously unknown TFs. In the subsystem-oriented approach, the training set for TFBS recognition program includes upstream regions of genes from the same metabolic pathway in the defined taxonomic group of bacteria. Phylogenetic footprinting identifies highly conserved regions in multiple alignments of upstream gene regions across the closely related species that are used to construct a PWM to search for additional TFBSs in the genomes.
Figure 6
Figure 6. Novel biotin regulon BioQ in Actinobacteria tentatively predicted by Strategy IIa
A. Chromosomal clusters of biotin synthesis and transport genes (shown by arrows) and localization of candidate BioQ-binding sites (red circles). Homologous genes are marked by matching colors. B. Biotin biosynthesis and uptake pathway. C. Consensus sequence logo for the predicted BioQ-binding sites.
Figure 7
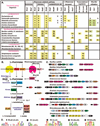
Figure 7. Reconstruction of L-rhamnose utilization system in bacteria
A. Occurence and features of genes involved in L-rhamnose utilization. Species in several taxonomic groups of bacteria are shown as rows. the presence of genes for the respective functional roles (columns) is shown by capital letters corresponding to the four identified rhamnose regulons: S, RahS regulon (as in E. coli); R1, R2, R3, and R3’ correspond to the novel regulons of the same names. Other genes that were not identified within the above rhamnose regulons are marked by ‘U’. Genes clustered on the chromosome (operons) are outlined by matching background colors. Tentatively predicted functional roles are marked by asterisks. Functional roles corresponding to the predicted bifunctional enzymes RhaE-RhaW are underlined. The four Rhizobiaceae genomes that have the same set of genes and genome context are Mesorhizobium loti (ML), Agrobacterium tumefaciens (AT), Rhizobium leguminosarum (RL), and Sinorhizobium meliloti (SM). B. The reconstructed L-rhamnose utilization pathway. C. Chromosomal clusters of L-rhamnose utilization genes (arrows) and localization of candidate binding sites (circles) for rhamnose-specific TFs. The genes corresponding to the rhamnose-specific regulators RhaS, RhaR, R1, R2, and R3 are shown by black arrows with S, R, R1, R2, and R3 letters, respectively. Other homologous genes are marked by matching colors. D. Consensus sequence logos for predicted binding sites of rhamnose-specific TFs. The corresponding TF protein family name is given in parenthesis.

References

    1. Baumberg S. Prokaryotic Gene Expression. Oxford: Oxford University Press; 1999.
    1. Lloyd G, Landini P, Busby S. Essays Biochem. 2001;37:17. - PubMed
    1. Kazmierczak MJ, Wiedmann M, Boor KJ. Microbiol. Mol. Biol. Rev. 2005;69:527. - PMC - PubMed
    1. Gollnick P, Babitzke P. Biochim. Biophys. Acta. 2002;1577:240. - PubMed
    1. Hodgson DA. Signals, Switches, Regulons, and Cascades. Cambridge: Cambridge University Press; 2002.

Publication types