

Parameter estimation and prediction for the course of a single epidemic outbreak of a plant disease
- PMID: 17638651
- PMCID: PMC2394548
- DOI: 10.1098/rsif.2007.1036
Parameter estimation and prediction for the course of a single epidemic outbreak of a plant disease
Abstract
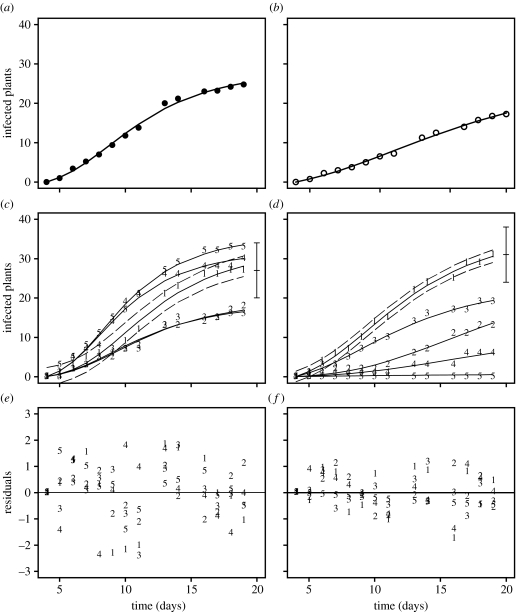
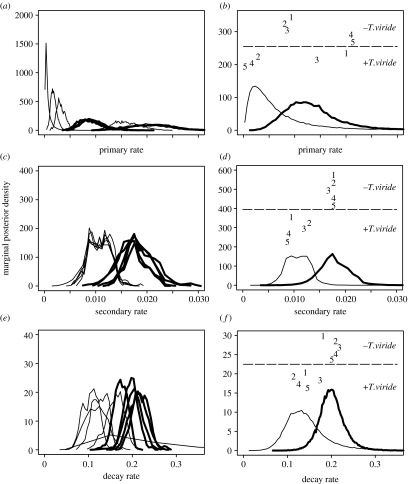
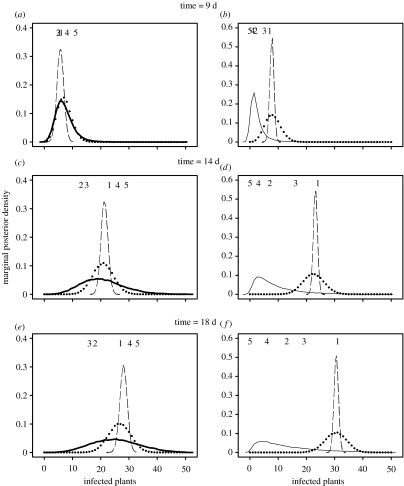
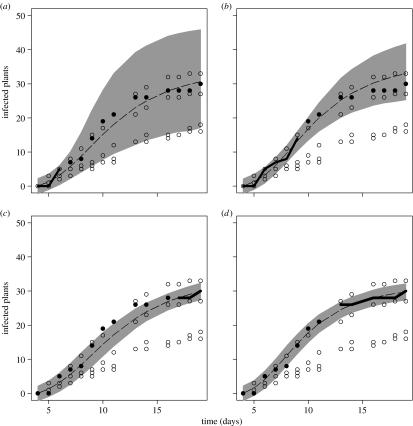
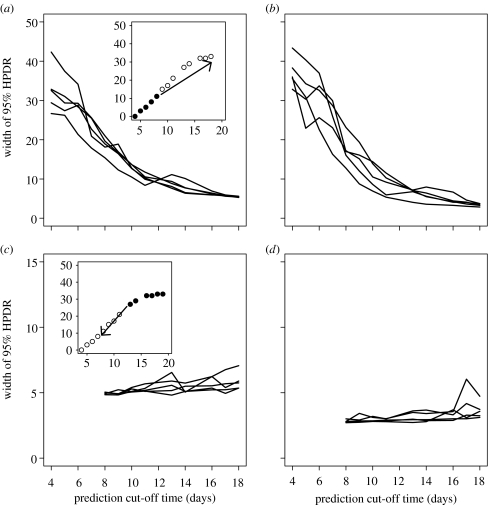
Many epidemics of plant diseases are characterized by large variability among individual outbreaks. However, individual epidemics often follow a well-defined trajectory which is much more predictable in the short term than the ensemble (collection) of potential epidemics. In this paper, we introduce a modelling framework that allows us to deal with individual replicated outbreaks, based upon a Bayesian hierarchical analysis. Information about 'similar' replicate epidemics can be incorporated into a hierarchical model, allowing both ensemble and individual parameters to be estimated. The model is used to analyse the data from a replicated experiment involving spread of Rhizoctonia solani on radish in the presence or absence of a biocontrol agent, Trichoderma viride. The rate of primary (soil-to-plant) infection is found to be the most variable factor determining the final size of epidemics. Breakdown of biological control in some replicates results in high levels of primary infection and increased variability. The model can be used to predict new outbreaks of disease based upon knowledge from a 'library' of previous epidemics and partial information about the current outbreak. We show that forecasting improves significantly with knowledge about the history of a particular epidemic, whereas the precision of hindcasting to identify the past course of the epidemic is largely independent of detailed knowledge of the epidemic trajectory. The results have important consequences for parameter estimation, inference and prediction for emerging epidemic outbreaks.
Figures
Similar articles
-
Bayesian analysis of botanical epidemics using stochastic compartmental models.Proc Natl Acad Sci U S A. 2004 Aug 17;101(33):12120-4. doi: 10.1073/pnas.0400829101. Epub 2004 Aug 9. Proc Natl Acad Sci U S A. 2004. PMID: 15302941 Free PMC article.
-
Predicting variability in biological control of a plant-pathogen system using stochastic models.Proc Biol Sci. 1999 Sep 7;266(1430):1743-53. doi: 10.1098/rspb.1999.0841. Proc Biol Sci. 1999. PMID: 10518323 Free PMC article.
-
Amendment with peony root bark improves the biocontrol efficacy of Trichoderma harzianum against Rhizoctonia solani.J Microbiol Biotechnol. 2008 Sep;18(9):1537-43. J Microbiol Biotechnol. 2008. PMID: 18852509
-
Tobacco leaf spot and root rot caused by Rhizoctonia solani Kühn.Mol Plant Pathol. 2011 Apr;12(3):209-16. doi: 10.1111/j.1364-3703.2010.00664.x. Epub 2010 Oct 1. Mol Plant Pathol. 2011. PMID: 21355993 Free PMC article. Review.
-
Antagonist effects of strains of Bacillus spp. against Rhizoctonia solani for their protection against several plant diseases: Alternatives to chemical pesticides.C R Biol. 2019 Jun-Aug;342(5-6):124-135. doi: 10.1016/j.crvi.2019.05.002. Epub 2019 Aug 9. C R Biol. 2019. PMID: 31402177 Review.
Cited by
-
Applying optimal control theory to a spatial simulation model of sudden oak death: ongoing surveillance protects tanoak while conserving biodiversity.J R Soc Interface. 2020 Apr;17(165):20190671. doi: 10.1098/rsif.2019.0671. Epub 2020 Apr 1. J R Soc Interface. 2020. PMID: 32228402 Free PMC article.
-
One model to rule them all? Modelling approaches across OneHealth for human, animal and plant epidemics.Philos Trans R Soc Lond B Biol Sci. 2019 Jun 24;374(1775):20180255. doi: 10.1098/rstb.2018.0255. Philos Trans R Soc Lond B Biol Sci. 2019. PMID: 31056049 Free PMC article. Review.
-
Using Combined Diagnostic Test Results to Hindcast Trends of Infection from Cross-Sectional Data.PLoS Comput Biol. 2016 Jul 6;12(7):e1004901. doi: 10.1371/journal.pcbi.1004901. eCollection 2016 Jul. PLoS Comput Biol. 2016. PMID: 27384712 Free PMC article.
-
Broadwick: a framework for computational epidemiology.BMC Bioinformatics. 2016 Feb 4;17:65. doi: 10.1186/s12859-016-0903-2. BMC Bioinformatics. 2016. PMID: 26846686 Free PMC article.
-
Economically optimal timing for crop disease control under uncertainty: an options approach.J R Soc Interface. 2010 Oct 6;7(51):1421-8. doi: 10.1098/rsif.2010.0056. Epub 2010 Apr 7. J R Soc Interface. 2010. PMID: 20375038 Free PMC article.
References
-
- Anderson R.M, May R.M. Oxford University Press; Oxford, UK: 1991. Infectious diseases of humans: dynamics and control.
-
- Barnett V. Wiley; Chichester, UK: 1999. Comparative statistical inference.
-
- Bjornstad O.N, Finkenstadt B.F, Grenfell B.T. Dynamics of measles epidemics: estimating scaling of transmission rates using a time series SIR model. Ecol. Monogr. 2002;72:169–184.
Publication types
MeSH terms
Grants and funding
LinkOut - more resources
Full Text Sources
Miscellaneous
