. 2007 Oct 15;110(8):3015-27.
doi: 10.1182/blood-2006-12-061507. Epub 2007 Jul 16.

Lesional gene expression profiling in cutaneous T-cell lymphoma reveals natural clusters associated with disease outcome

Affiliations

Lesional gene expression profiling in cutaneous T-cell lymphoma reveals natural clusters associated with disease outcome

Jessica Shin et al. Blood. .

Erratum in

  • Blood. 2008 Jan 1;111(1):49

Abstract

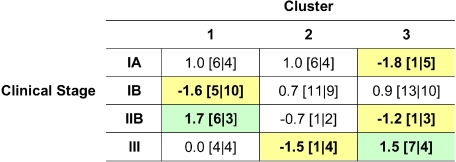
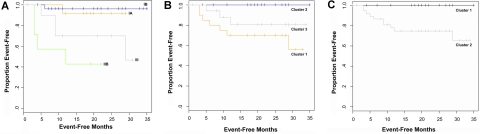
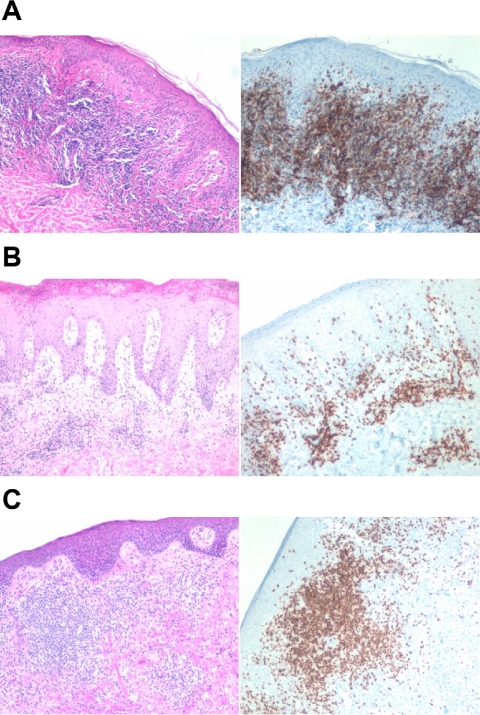
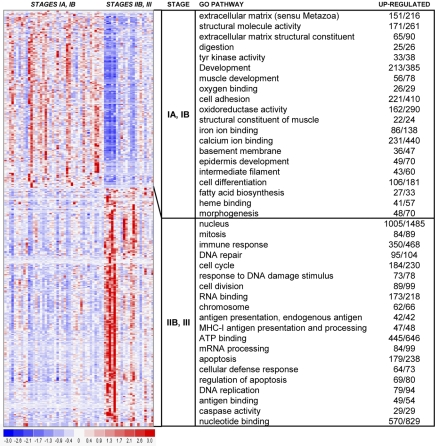
Cutaneous T-cell lymphoma (CTCL) is defined by infiltration of activated and malignant T cells in the skin. The clinical manifestations and prognosis in CTCL are highly variable. In this study, we hypothesized that gene expression analysis in lesional skin biopsies can improve understanding of the disease and its management. Based on 63 skin samples, we performed consensus clustering, revealing 3 patient clusters. Of these, 2 clusters tended to differentiate limited CTCL (stages IA and IB) from more extensive CTCL (stages IB and III). Stage IB patients appeared in both clusters, but those in the limited CTCL cluster were more responsive to treatment than those in the more extensive CTCL cluster. The third cluster was enriched in lymphocyte activation genes and was associated with a high proportion of tumor (stage IIB) lesions. Survival analysis revealed significant differences in event-free survival between clusters, with poorest survival seen in the activated lymphocyte cluster. Using supervised analysis, we further characterized genes significantly associated with lower-stage/treatment-responsive CTCL versus higher-stage/treatment-resistant CTCL. We conclude that transcriptional profiling of CTCL skin lesions reveals clinically relevant signatures, correlating with differences in survival and response to treatment. Additional prospective long-term studies to validate and refine these findings appear warranted.


Figures

Figure 1
Figure 1
Gene filtering. A total of 22 283 probe sets were filtered using a noise envelope to eliminate genes with little cross-chip variability. The noise envelope was estimated on 14 HeLa cell lines and 5 Strategene samples. Two filters were used, resulting in gene sets of 6997 (α = 0.999) and 4204 (α = 0.9999) probe sets. Unsupervised analyses were done using the 4204-gene filter. Supervised analyses were done using the 6997-gene filter.
Figure 2
Figure 2
Consensus clustering. Consensus clustering indicates that 3 clusters is the greatest number of stable clusters across clustering techniques. Consensus heat maps produced by HC and SOMs for cluster number k = 3 are shown. The consensus heat map is a visual representation of the consensus matrix, which is a matrix of sample pairs. Each matrix entry is the proportion of times the pair's samples are clustered together across resampling iterations. In the heat map, a value of 1 (corresponding to 2 samples that are always clustered together) is represented by the color red, and a value of 0 (corresponding to 2 samples that are never clustered together) is represented by the color white.
Figure 3
Figure 3
Consensus clustering overlap matrices for the 3-cluster model.(A) Sample overlap comparing sample assignment between HC and SOMs. Entries are the number of samples in overlapping clusters. (B) Marker overlap between HC and SOMs. Gene markers for k = 3 clusters using HC and SOMs were evaluated to assess the number of markers held in common between clustering techniques. Entries are presented as: residual [no. observed | no. expected], where residual = (observed −expected) / sqrt (expected).
Figure 4
Figure 4
Hierarchical clustering heat map. This heat map shows partitioning of 63 samples and the top 593 genes with P values less than or equal to .025 and fold change greater than or equal to 2. The chart shows the top 15 GO terms for each cluster, ranked by FDR. Each GO term is accompanied by the number of up-regulated genes/the total number of genes included in the test group. All included GO terms have P values less than or equal to .05 and FDR less than or equal to .05.
Figure 5
Figure 5
Cluster composition based on clinical stage. Entries are presented as: residual [no. observed | no. expected], where residual = (observed −expected) /sqrt (expected). Yellow indicates relative deficiency of cluster with respect to the clinical stage, and green indicates enrichment of cluster with respect to the clinical stage, comparing observed with expected composition. Sample phenotype correlation showed cluster 1 to be composed of a roughly equivalent proportion of clinical stages. However, this breakdown was statistically enriched with stage IIB, or tumor stage, disease and lacking in stage IB disease. Cluster 2 was enriched with patch/plaque stage disease, with only 2 samples categorized as stage IIB and III. Cluster 3 showed depletion in stage IA and IIB disease and enrichment in stage IB and III disease. These findings were statistically significant, with a P value of .004.
Figure 6
Figure 6
Event-free Kaplan-Meier curves. Survival was evaluated using Kaplan-Meier analysis. Events included disease progression, large-cell transformation, and death. There were 10 events, including 7 deaths, 1 large-cell transformation after biopsy, and 3 patients who progressed despite systemic treatments. The log-rank test was used to determine significance of differences between survival curves. Event-free survival is shown (A) by clinical stage (P < .001); (B) by hierarchical cluster, using a 3-cluster partition (P = .028); and (C) by hierarchical cluster, using a 2-cluster partition (P = .02).
Figure 7
Figure 7
Histologic and immunophenotypical correlation with cluster. Representative biopsies are shown. Left panels are the hematoxylin-eosin stain, and right panels are immunohistochemical stains using monoclonal antibody to CD3. (A) Cluster 2: stage IA, untreated erythematous plaque on the chest. (B) Cluster 3: top 2 panels depict a stage IB lesion, while the bottom panel shows a stage III lesion. All images were acquired on a Nikon Eclipse E600 microscope (Nikon, Melville, NY) with a 10×/0.30 objective using a SPOT digital camera and image acquisition software (Diagnostic Instruments, Sterling Heights, MI).
Figure 8
Figure 8
Heat map showing gene selection for stage IA/IB compared with stage IIB/III. Our analysis yielded gene sets of 480 genes with FDR less than or equal to 0.05, using the gene filter for 6997 genes, ranked by signal-to-noise ratio. The chart shows the top 20 GO terms for each stage, ranked by FDR. Each GO term is accompanied by the number of up-regulated genes/the total number of genes included in the test group. All included GO terms have cutoffs of .05 for both P value and FDR.
Figure 9
Figure 9
Comparison with published results. Tracey et al examined genes included on the CNIO Oncochip microarray platform, a subset of the genes included on the Affymetrix HG-U133 microarray platform. They identified 2 main subgroups of patients using hierarchical clustering. We compared this to our 3-cluster division determined through consensus clustering. Sample clustering in the space of genes identified by Tracey et al showed significant consistency with our results, despite only 21% overlap between genes used in clustering. We also examined a less optimized 2-cluster structure of our data for comparison, and found relatively good overlap with the 2-cluster structure of Tracey et al. (A) 3-cluster structure. 79% of samples overall were correctly classified. This result was significant (P < .001). (B) 2-cluster structure. 87% of samples overall were correctly classified using a 2-cluster structure. The result was again significant (P < .001). (C) Gene correlation. Genes were similarly classified for 71% of 130 common genes. Genes associated with more aggressive disease by Tracey et al were found to be associated with more advanced disease in our study as well. This finding was significant (P < .001).

Similar articles

Cited by

References

    1. Shin J, Jones DA, Hurwitz D, Kupper TS. Gene expression profiling in cutaneous T cell lymphoma skin lesions. J Invest Dermatol. 2006;126(Supplement):24.
    1. Willemze R, Jaffe ES, Burg G, et al. WHO-EORTC classification for cutaneous lymphomas. Blood. 2005;105:3768–3785. - PubMed
    1. Zackheim HS, Amin S, Kashani-Sabet M, McMillan A. Prognosis in cutaneous T-cell lymphoma by skin stage: long-term survival in 489 patients. J Am Acad Dermatol. 1999;40:418–425. - PubMed
    1. Diamandidou E, Colome-Grimmer M, Fayad L, Duvic M, Kurzrock R. Transformation of mycosis fungoides/Sezary syndrome: clinical characteristics and prognosis. Blood. 1998;92:1150–1159. - PubMed
    1. Kim YH, Liu HL, Mraz-Gernhard S, Varghese A, Hoppe RT. Long-term outcome of 525 patients with mycosis fungoides and Sezary syndrome: clinical prognostic factors and risk for disease progression. Arch Dermatol. 2003;139:857–866. - PubMed