. 2007 Jul 17:1:30.
doi: 10.1186/1752-0509-1-30.

The correlation between architecture and mRNA abundance in the genetic regulatory network of Escherichia coli

Affiliations

The correlation between architecture and mRNA abundance in the genetic regulatory network of Escherichia coli

Yohann Grondin et al. BMC Syst Biol. .

Abstract

Background: Two aspects of genetic regulatory networks are the static architecture that describes the overall connectivity between the genes and the dynamics that describes the sequence of genes active at any one time as deduced from mRNA abundances. The nature of the relationship between these two aspects of these networks is a fundamental question. To address it, we have used the static architecture of the connectivity of the regulatory proteins of Escherichia coli to analyse their relationship to the abundance of the mRNAs encoding these proteins. In this we build on previous work which uses Boolean network models, but impose biological constraints that cannot be deduced from the mRNA abundances alone.

Results: For a cell population of E. coli, we find that there is a strong and statistically significant linear dependence between the abundance of mRNA encoding a regulatory protein and the number of genes regulated by this protein. We use this result, together with the ratio of regulatory repressors to promoters, to simulate numerically a genetic regulatory network of a single cell. The resulting model exhibits similar correlations to that of E. coli.

Conclusion: This analysis clarifies the relationship between the static architecture of a regulatory network and the consequences for the dynamics of its pattern of mRNA abundances. It also provides the constraints on the architecture required to construct a model network to simulate mRNA production.


Figures

Figure 1
Figure 1
The mRNA abundance versus incoming degrees of connectivity in E. coli. The relative mRNA abundances (on an arbitrary scale) as given by microarray experiments are averaged according to the incoming degree of the corresponding genes, that is the number of transcription factors regulating the given genes, and plotted against that degree. Only the genes that have an incoming degree greater than 0 have been selected, that is 787 genes. The error bars give the standard deviation.
Figure 2
Figure 2
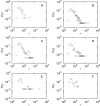
Distribution of mRNA abundances per incoming degree of connectivity in E. coli. Each graph represents the distribution of mRNA abundance for a given incoming degree of connectivity, kin, that is the probability P(r) of finding a mRNA at abundance r for a given number of proteins regulating the corresponding genes. Graph A shows the distribution of mRNA abundance corresponding to the genes with kin = 1, graph B for kin = 2, graph C for kin = 3, graph D for kin = 4, graph E for kin = 5 and graph F for kin = 6. In graphs B, C and D the distribution of abundance appears clearly to follow a power-law tail which confirms the large standard deviation observed in Figure 1 when the mRNA abundance is averaged according to the incoming degree.
Figure 3
Figure 3
Abundance of transcription factor versus their outgoing degree of connectivity in E. coli. The relative mRNA abundances (on an arbitrary scale) as given by microarray experiments are averaged according to the outgoing degree of the corresponding genes, that is the number genes the corresponding protein regulates, and plotted against that degree. Only the genes that have an outgoing degree greater than 0 have been selected, that is 113 genes. The error bars give the standard deviation.
Figure 4
Figure 4
Abundance of transcription factor versus their incoming degree of connectivity in the simulation. The plotted mRNA abundance is the simulated mRNA abundance averaged over time for a given value of the incoming degree of connectivity of the corresponding nodes. Only the nodes that have been ON at least once during the recorded period and that have an incoming degree of connectivity greater than 0 have been recorded, in this case 732 nodes. The error bars give the standard deviation.
Figure 5
Figure 5
Abundance of transcription factor versus their outgoing degree of connectivity in the simulation. The plotted abundance is the simulated mRNA abundance averaged over time at a given value of the outgoing degree of connectivity of the corresponding node. Only the nodes that have been ON at least once during the recorded period and that have an outgoing degree of connectivity greater than 0 have been recorded, in this case 730 nodes. The error bars give the standard deviation.

Similar articles

Cited by

References

    1. Rual JF, Venkatesan K, Hao T, Hirozane-Kishikawa T, Dricot A, Li N, Berriz GF, Gibbons FD, Dreze M, Ayivi-Guedehoussou N, Klitgord N, Simon C, Boxem M, Milstein S, Rosenberg J, Goldberg DS, Zhang LV, Wong SL, Franklin G, Li S, Albala JS, Lim J, Fraughton C, Llamosas E, Cevik S, Bex C, Lamesch P, Sikorski RS, Vandenhaute J, Zoghbi HY, Smolyar A, Bosak S, Sequerra R, Doucette-Stamm L, Cusick ME, Hill DE, Roth FP, Vidal M. Towards a proteome-scale map of the human protein-protein interaction network. Nature. 2005;437:1173–1178. doi: 10.1038/nature04209. - DOI - PubMed
    1. Schwikowski B, Uetz P, Fields S. A network of protein-protein interactions in yeast. Nat Biotechnol. 2000;18:1257–1261. doi: 10.1038/82360. - DOI - PubMed
    1. Rain JC, Selig L, De Reuse H, Battaglia V, Reverdy C, Simon S, Lenzen G, Petel F, Wojcik J, Schachter V, Chemama Y, Labigne A, Legrain P. The protein-protein interaction map of Helicobacter pylori. Nature. 2001;409:211–215. doi: 10.1038/35051615. - DOI - PubMed
    1. Raine DJ, Norris V. Network Structure of Metabolic Pathways. InterJournal of Complex Systems. 2000.
    1. Jeong H, Tombor B, Albert R, Oltvai ZN, Barabasi AL. The large-scale organization of metabolic networks. Nature. 2000;407:651–654. doi: 10.1038/35036627. - DOI - PubMed

MeSH terms

LinkOut - more resources