Comparative Study
. 2007 Jul 18:8:242.
doi: 10.1186/1471-2164-8-242.

MADS-box gene family in rice: genome-wide identification, organization and expression profiling during reproductive development and stress

Affiliations
Comparative Study

MADS-box gene family in rice: genome-wide identification, organization and expression profiling during reproductive development and stress

Rita Arora et al. BMC Genomics. .

Abstract

Background: MADS-box transcription factors, besides being involved in floral organ specification, have also been implicated in several aspects of plant growth and development. In recent years, there have been reports on genomic localization, protein motif structure, phylogenetic relationships, gene structure and expression of the entire MADS-box family in the model plant system, Arabidopsis. Though there have been some studies in rice as well, an analysis of the complete MADS-box family along with a comprehensive expression profiling was still awaited after the completion of rice genome sequencing. Furthermore, owing to the role of MADS-box family in flower development, an analysis involving structure, expression and functional aspects of MADS-box genes in rice and Arabidopsis was required to understand the role of this gene family in reproductive development.

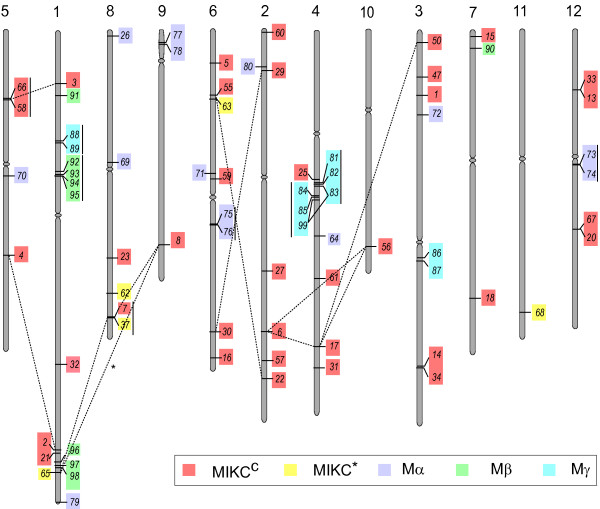
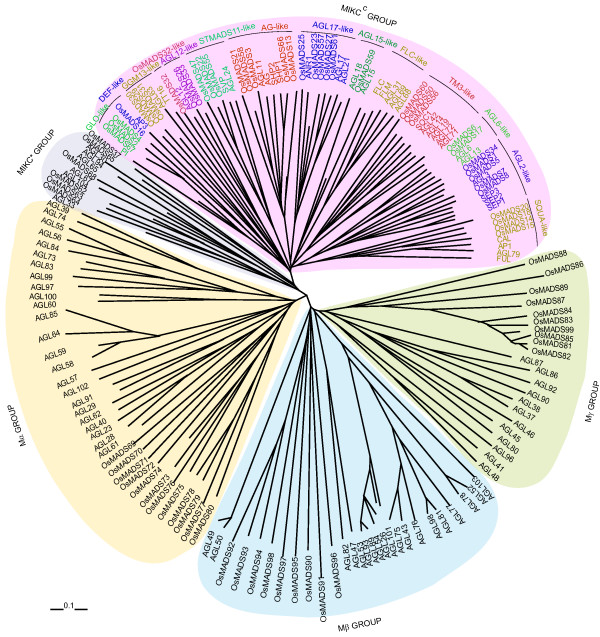
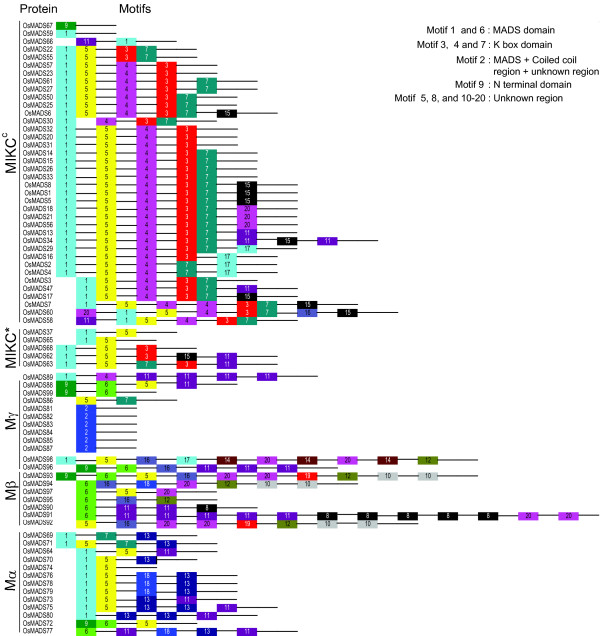
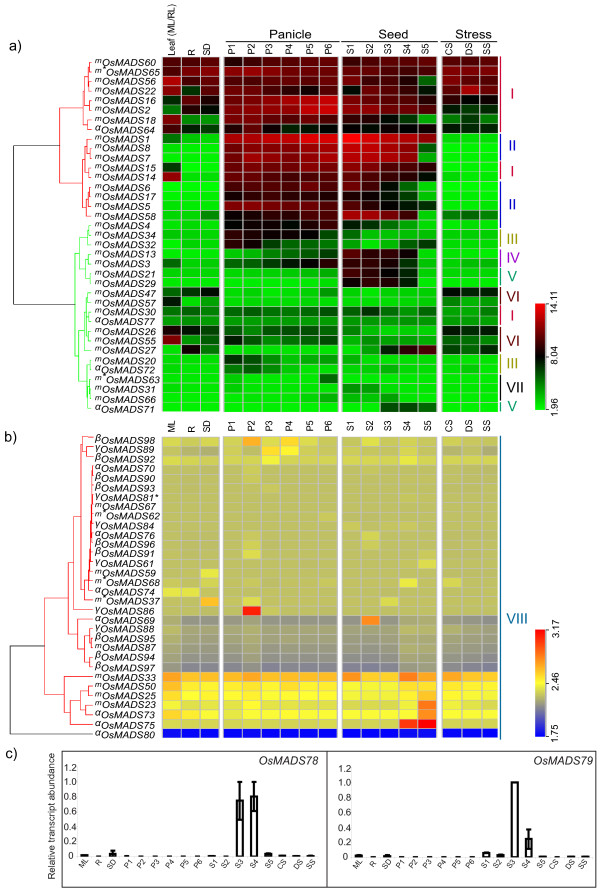
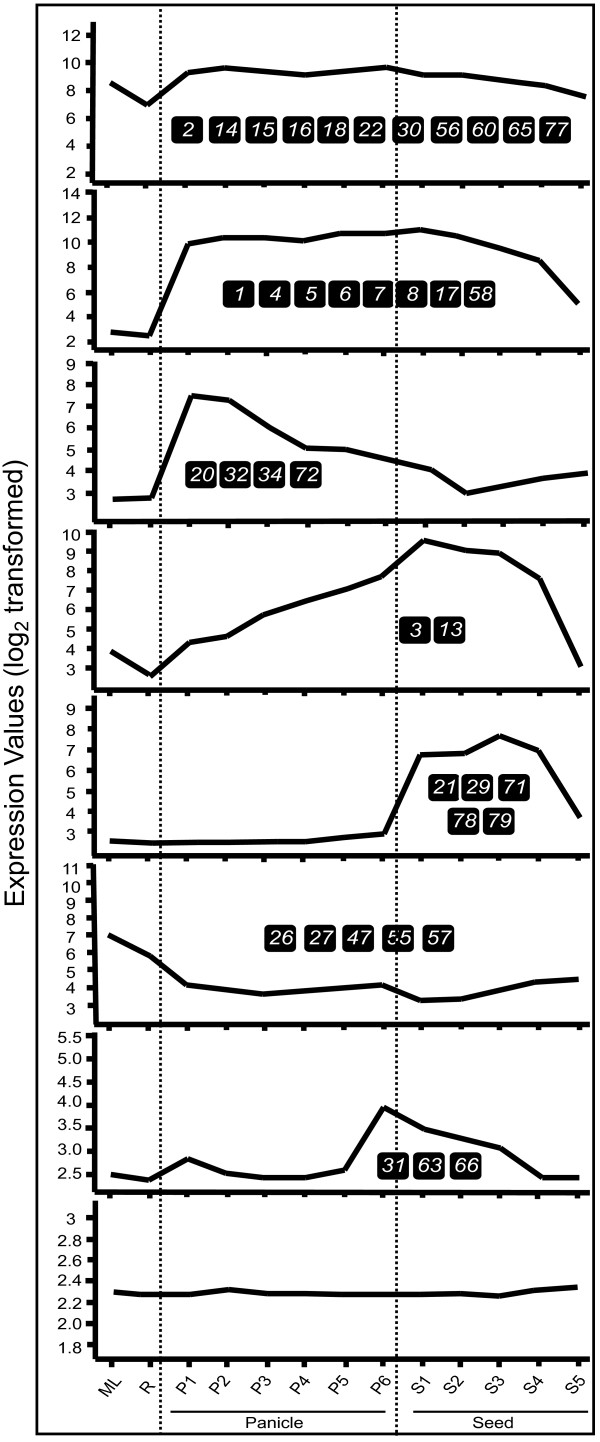
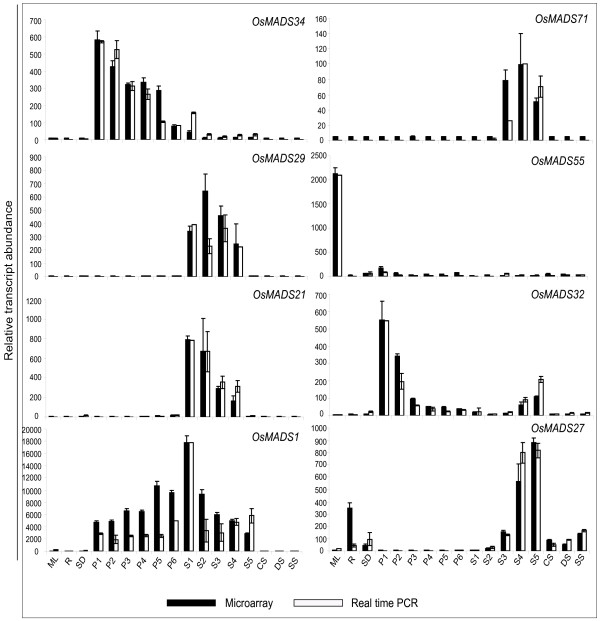
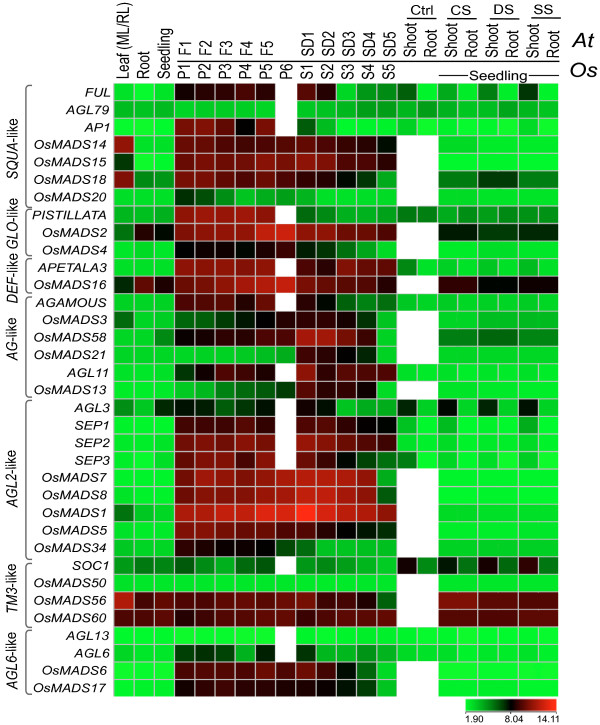
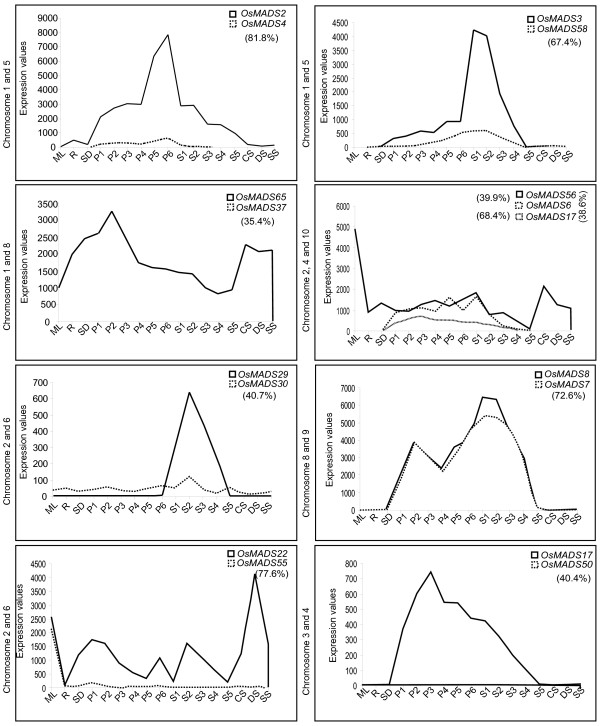
Results: A genome-wide molecular characterization and microarray-based expression profiling of the genes encoding MADS-box transcription factor family in rice is presented. Using a thorough annotation exercise, 75 MADS-box genes have been identified in rice and categorized into MIKCc, MIKC*, Malpha, Mbeta and Mgamma groups based on phylogeny. Chromosomal localization of these genes reveals that 16 MADS-box genes, mostly MIKCc-type, are located within the duplicated segments of the rice genome, whereas most of the M-type genes, 20 in all, seem to have resulted from tandem duplications. Nine members belonging to the Mbeta group, which was considered absent in monocots, have also been identified. The expression profiles of all the MADS-box genes have been analyzed under 11 temporal stages of panicle and seed development, three abiotic stress conditions, along with three stages of vegetative development. Transcripts for 31 genes accumulate preferentially in the reproductive phase, of which, 12 genes are specifically expressed in seeds, and six genes show expression specific to panicle development. Differential expression of seven genes under stress conditions is also evident. An attempt has been made to gain insight into plausible functions of rice MADS-box genes by collating the expression data of functionally validated genes in rice and Arabidopsis.

Conclusion: Only a limited number of MADS genes have been functionally validated in rice. A comprehensive annotation and transcriptome profiling undertaken in this investigation adds to our understanding of the involvement of MADS-box family genes during reproductive development and stress in rice and also provides the basis for selection of candidate genes for functional validation studies.


Figures

Figure 1
Figure 1
Chromosomal location of rice MADS-box genes. 75 MADS-box genes have been mapped on rice chromosomes according to 5' and 3' coordinates mentioned in TIGR. Respective chromosome numbers are written at the top. Genes belonging to five groups have been marked by different colors (MIKCc, red; MIKC*, yellow; Mα, purple; Mβ, green and Mγ, blue). Genes lying on duplicated segments of genome have been joined by dashed lines. Tandemly duplicated genes are joined with vertical lines. (* The duplicated segment between chromosome 1 and 9 containing OsMADS65 and 8, respectively, could be detected only in segmental duplication database with 500 kb and not with 100 kb distance allowed between collinear genes in TIGR, for details see experimental procedures).
Figure 2
Figure 2
Phylogenetic analysis of rice and Arabidopsis MADS-box proteins. Phylogenetic analysis of 173 MADS-box proteins from rice (75) and Arabidopsis (98), showing similar groups in both the plant species as given by Parenicova and coworkers [6]. Total of 14 clades formed by MIKCc-type genes are also marked. Scale bar represents 0.1 amino acid substitution per site.
Figure 3
Figure 3
Distribution of Conserved motifs in rice MADS-box proteins identified using MEME search tool. Schematic representation of motifs identified in rice MADS-box proteins using MEME motif search tool for each group given separately. Each motif is represented by a number in colored box. Length of box does not correspond to length of motif. Order of the motifs corresponds to position of motifs in individual protein sequence. For detail of motifs refer to supplementary material.
Figure 4
Figure 4
Expression Analysis of MADS-box genes in rice. a) Hierarchical cluster display of expression profile for thirty seven MADS-box genes showing high level expression in rice. (Color bar at the base represents log2 expression values, thereby green color representing low level expression, black shows medium level expression and red signifies high level expression). b) Hierarchical cluster display of expression profile for thirty two MADS-box genes showing low level expression in rice. (Color bar at the base represents log2 expression values, thereby blue color representing low level expression, yellow shows medium level expression and red signifies high level expression). Developmental stages used for expression profiling are mentioned on top of each column. Panicle and seed stages have been listed in the temporal order of development. On the left side of expression map, cluster dendrogram is shown. On the right side, eight groups have been made for the genes showing discrete expression patterns (Figure 5). Symbol * represents accumulative expression profiles of duplicated genes, OsMADS81, 82, 85 and 99. Genes belonging to the different groups have been marked by a symbol (m, MIKCc; m*, MIKC*; α, Mα; β, Mβ and γ, Mγ). c) Results of QPCR for OsMADS78 and 79. Expression profiles of OsMADS78 and 79 using QPCR. X-axis represents the developmental stages as given in Table 2. Y-axis represents relative expression values obtained after normalizing against maximum expression value. Error bars show the standard error for two biological replicates performed.
Figure 5
Figure 5
Expression patterns of MADS-box genes in rice in vegetative as well as panicle and seed development. Expression profiles have been generated using avadis™ software version 4.2. X-axis represents the developmental stages. Y-axis represents average log2 expression values. Genes exhibiting these expression patterns have been represented by numbers. Dotted lines have been drawn to demarcate vegetative organs, panicle and seed developmental stages.
Figure 6
Figure 6
QPCR results for selected eight genes and its correlation with microarray data. Two and three biological replicates have been taken for QPCR and microarray, respectively. Standard error bars have been shown for data obtained using both the techniques. Y-axis represents raw expression values obtained using microarays, QPCR data has been normalized to ease profile matching with that of microarrays. X-axis depicts developmental stages as explained in table 2.
Figure 7
Figure 7
Differential expressions shown by seven MADS-box genes in response to various abiotic stress conditions. Left panel shows four genes up regulated and right panel shows down regulated genes more than 2 folds with p value less than 0.05 in response to three abiotic stress conditions. X-axis represents seedling followed by stress samples (CS, cold stress; DS, dehydration stress; SS, salt stress). Y-axis represents average expression values obtained using microarrays. Error bars represent standard error for data obtained in three biological replicates.
Figure 8
Figure 8
Expression profiles of selected rice and Arabidopsis MADS-box genes. (Color bar at the base represents log2 expression values, thereby green color representing low level expression, black shows medium level expression and red signifies high level expression). Expression profiles of selected MADS-box genes showing high sequence similarity and similar expression pattern in comparable stages. Developmental stages from Oryza sativa (Os) and Arabidopsis thaliana (At) used for expression profiling are mentioned on top of each column listed in the temporal order of development. On the left side of expression map, clade names are given. Developmental stages used for Arabidopsis are as follows: Leaf, 21 day rosette leaf (RL); Root, roots of 7-day old seedling; Seedling, 7-day old seedlings; F1-F5, flower stage 9, 10/11, 12, 15 and 28 day mature flower; SD1-SD5, seed stage 3, 5, 7, 9 and 10. For Stress, shoots and roots of 16-day-old seedling subjected to cold/drought/salt stress for 4 hours were selected.
Figure 9
Figure 9
MADS-box genes lying on duplicated segments of rice genome and their expression pattern. Expression patterns of duplicated genes have been compared in this figure. X-axis represents the developmental stages as given in table 2. Y-axis represents the raw expression values obtained using microarrays. Chromosome numbers on the left of each graph represent the duplicated segments on which the duplicated genes were identified. Homology for each duplicated gene pair is given in brackets.

Similar articles

Cited by

References

    1. de Folter S, Angenent GC. trans meets cis in MADS science. Trends Plant Sci. 2006;11:224–231. doi: 10.1016/j.tplants.2006.03.008. - DOI - PubMed
    1. Jack T. Plant development going MADS. Plant Mol Biol. 2001;46:515–520. doi: 10.1023/A:1010689126632. - DOI - PubMed
    1. Kaufmann K, Melzer R, Theissen G. MIKC-type MADS-domain proteins: structural modularity, protein interactions and network evolution in land plants. Gene. 2005;347:183–198. doi: 10.1016/j.gene.2004.12.014. - DOI - PubMed
    1. Nam J, dePamphilis CW, Ma H, Nei M. Antiquity and evolution of the MADS-box gene family controlling flower development in plants. Mol Biol Evol. 2003;20:1435–1447. doi: 10.1093/molbev/msg152. - DOI - PubMed
    1. Ng M, Yanofsky MF. Function and evolution of the plant MADS-box gene family. Nat Rev Genet. 2001;2:186–195. doi: 10.1038/35056041. - DOI - PubMed

Publication types

MeSH terms

Substances