. 2007 May-Jun;24(3):409-21.
doi: 10.1017/S0952523807070423. Epub 2007 Jul 20.

Mechanisms for persistent microphthalmia following ethanol exposure during retinal neurogenesis in zebrafish embryos

Affiliations

Mechanisms for persistent microphthalmia following ethanol exposure during retinal neurogenesis in zebrafish embryos

Bhavani Kashyap et al. Vis Neurosci. 2007 May-Jun.

Abstract

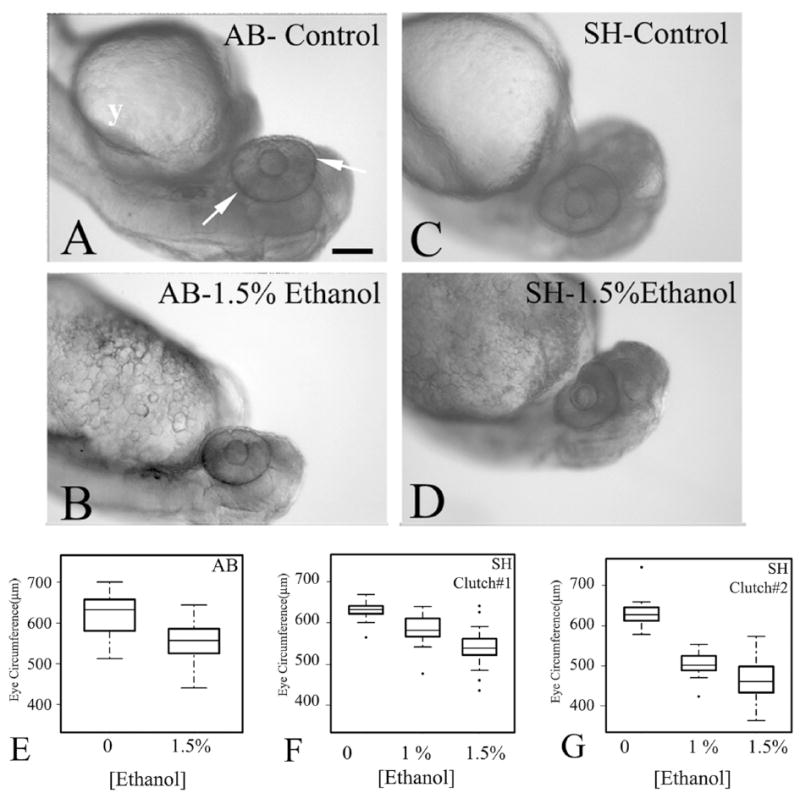
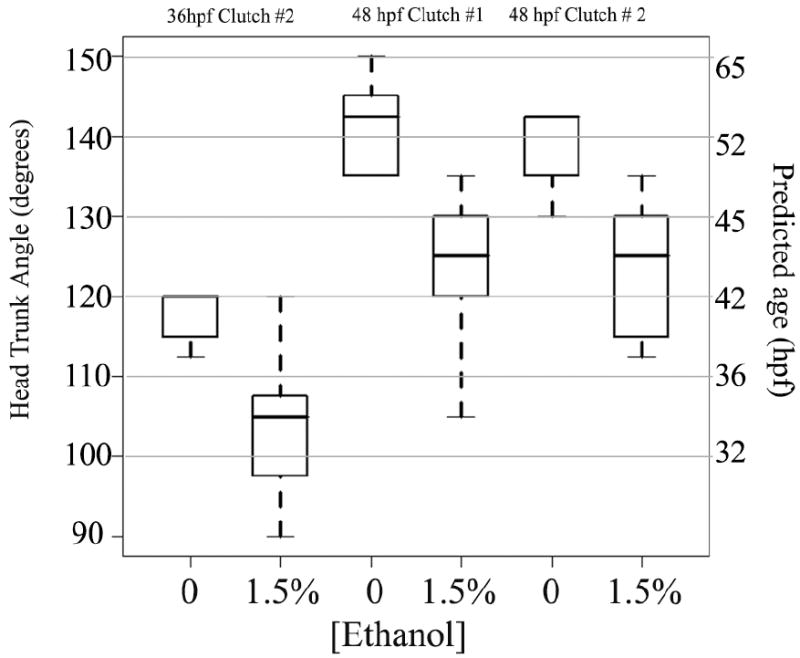
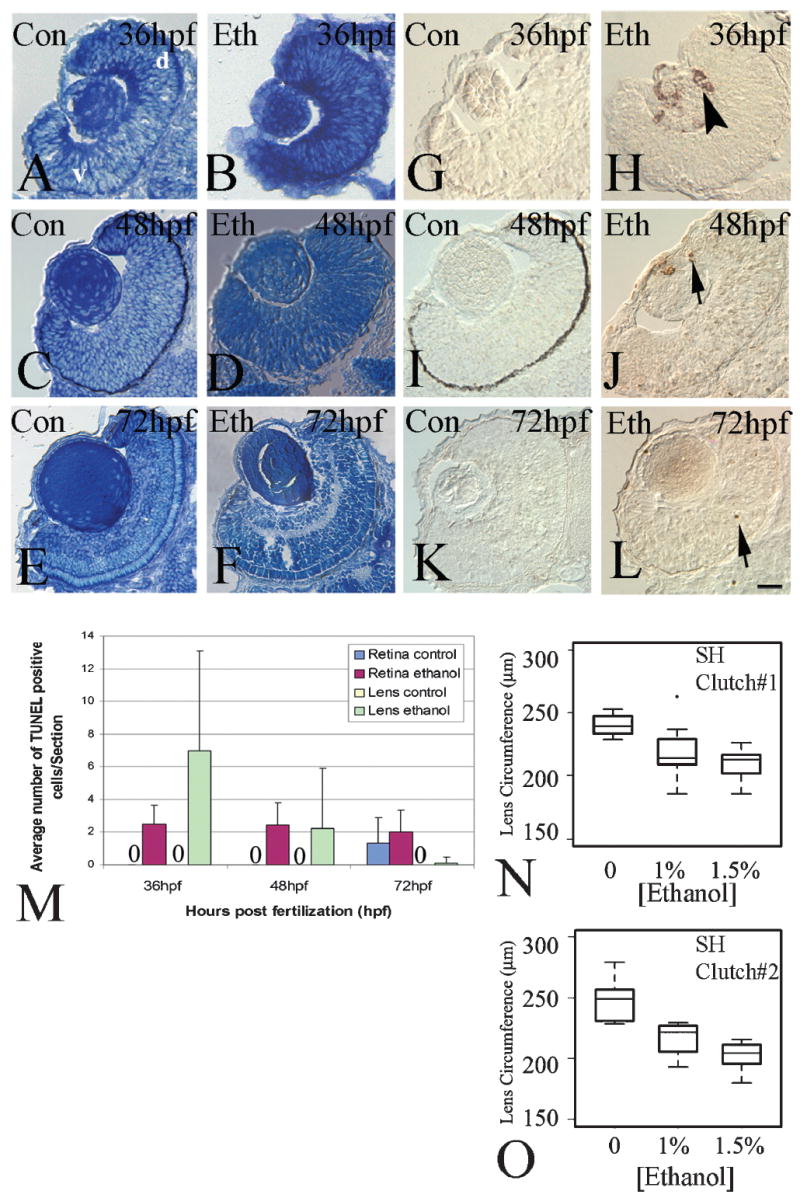
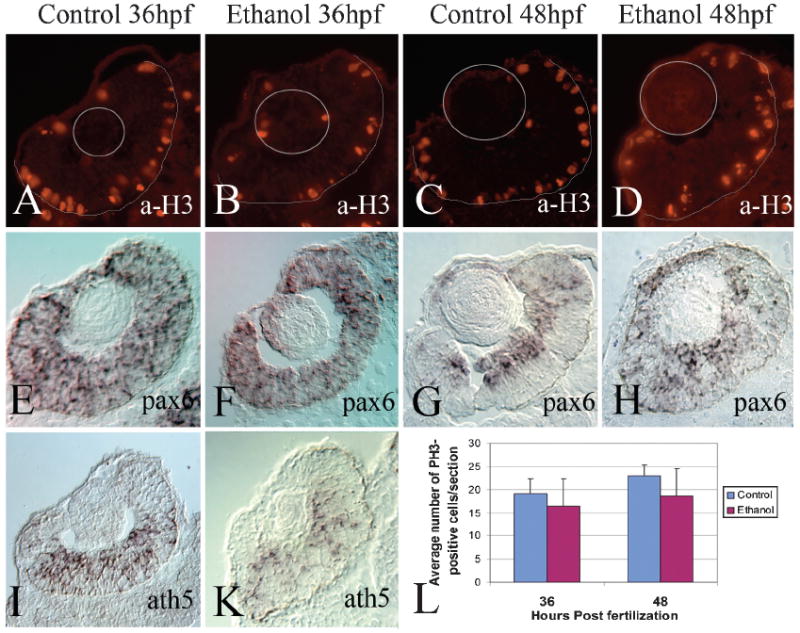
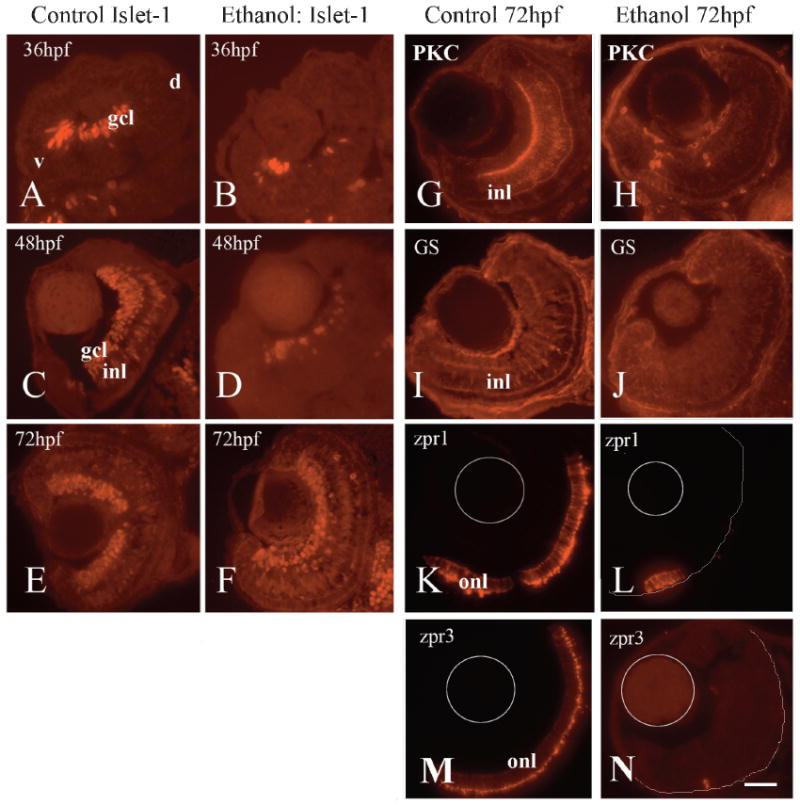
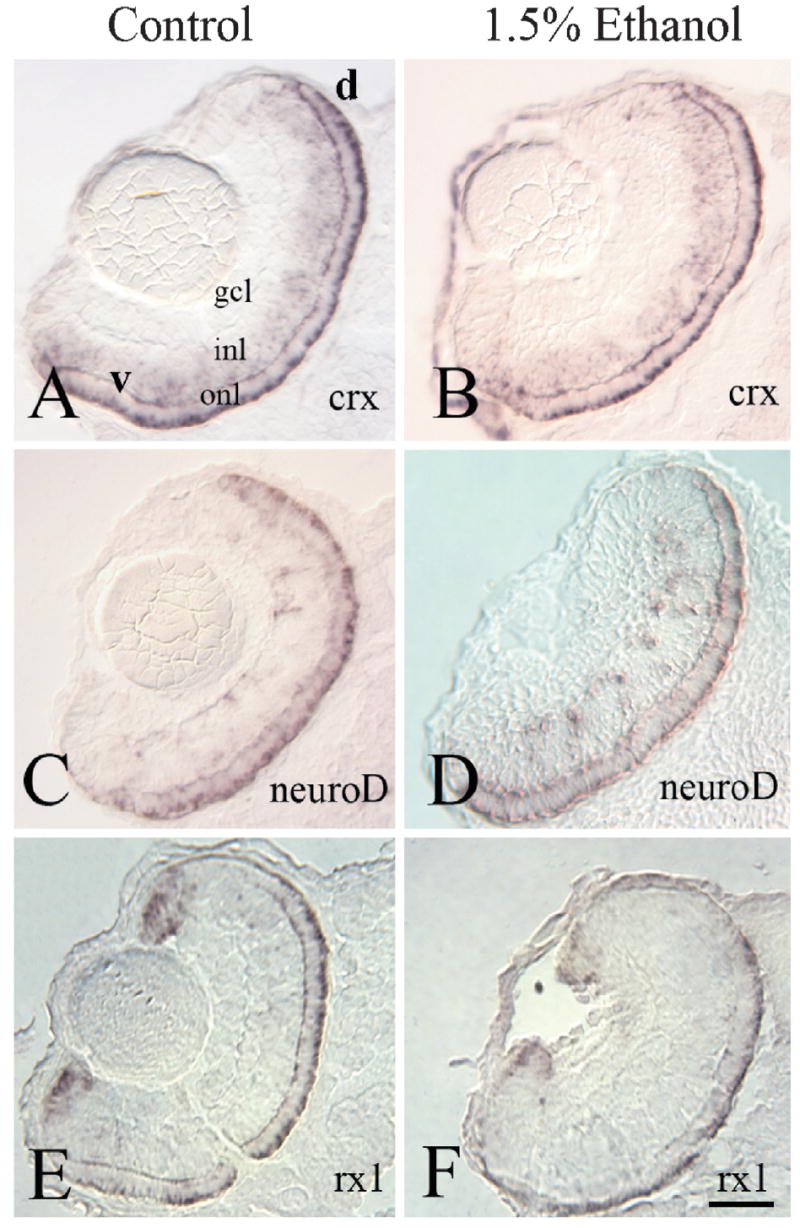
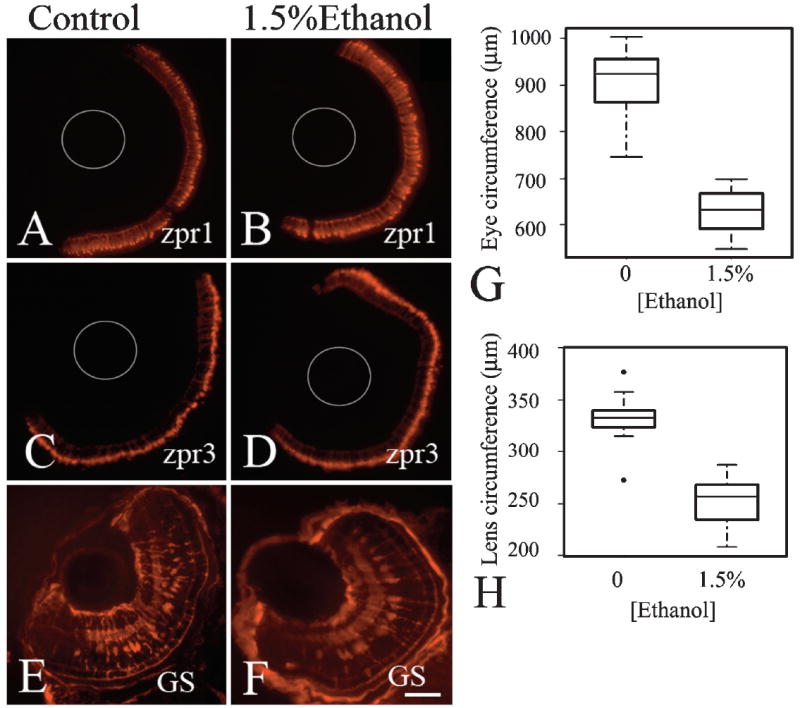
The exposure of the developing human embryo to ethanol results in a spectrum of disorders involving multiple organ systems, including the visual system. One common phenotype seen in humans exposed to ethanol in utero is microphthalmia. The objective of this study was to describe the effects of ethanol during retinal neurogenesis in a model organism, the zebrafish, and to pursue the potential mechanisms by which ethanol causes microphthalmia. Zebrafish embryos were exposed to 1% or 1.5% ethanol from 24 to 48 h after fertilization, a period during which the retinal neuroepithelium undergoes rapid proliferation and differentiation to form a laminated structure composed of different retinal cell types. Ethanol exposure resulted in significantly reduced eye size immediately following the treatment, and this microphthalmia persisted through larval development. This reduced eye size could not entirely be accounted for by the accompanying general delay in embryonic development. Retinal cell death was only slightly higher in ethanol-exposed embryos, although cell death in the lens was extensive in some of these embryos, and lenses were significantly reduced in size as compared to those of control embryos. The initiation of retinal neurogenesis was not affected, but the subsequent waves of cell differentiation were markedly reduced. Even cells that were likely generated after ethanol exposure--rod and cone photoreceptors and Müller glia--were delayed in their expression of cell-specific markers by at least 24 h. We conclude that ethanol exposure over the time of retinal neurogenesis resulted in persistent microphthalmia due to a combination of an overall developmental delay, lens abnormalities, and reduced retinal cell differentiation.


Figures

Fig. 1
Fig. 1
Ethanol exposure from 24 to 48 hpf results in microphthalmia in two strains of zebrafish. Panels AD show representative photos of untreated (A, C), and ethanol-exposed (B, D) embryos of the AB (A, B) and SH (C, D) strains. The white arrows in panels A indicate the boundaries used for circumference measurements. Bar =100 μm (magnification same for A–D); y, yolk. Panels E-G show boxplots of eye circumference measurements from one clutch of AB embryos (E: control n = 24; ethanol n = 22), and two clutches of SH embryos (F: control n =11; 1% ethanol n =19; 1.5% ethanol n = 22; G: control n =12; 1% ethanol n = 29; 1.5% ethanol = 33). In the boxplots, the boxes delineate the 25th to 75th percentiles, the dark horizontal lines depict the medians, the whiskers depict the upper and lower limits, and the filled circles depict outliers as defined by R statistical software.
Fig. 2
Fig. 2
Ethanol exposure from 24 to 48 hpf results in progressive developmental delay. Head-trunk angle (Y-axis on the left) was measured according to Westerfield (1995; see Materials and methods, and see figure at http://zfin.org/zf_info/zfbook/stages/figs/fig33.html), and used to predict an estimated corresponding developmental age (Y-axis on the right; Westerfield, 1995). Measurements were performed at 36 hpf (control n = 5; ethanol n = 7) and 48 hpf (control clutch#1 n = 9; ethanol n = 13; clutch#2 control n=9; ethanol n=9). In the boxplots, the boxes delineate the 25th to 75th percentiles, the dark horizontal lines depict the medians, and the whiskers depict the upper and lower limits as defined by R statistical software.
Fig. 3
Fig. 3
Histology, cell death, and lens circumference in the retinas of ethanol-treated embryos. Panels A–F show representative photos of methylene blue/azure II-stained retinas of untreated (A, C, E), and ethanol-exposed embryos (B, D, F), processed at 36 hpf (A, B), 48 hpf (C, D) and 72 hpf (E,F). Panels G–L show representative photos of TUNEL-stained retinas of untreated (G, I, K), and ethanol-exposed embryos (H, J, L), processed at 36 hpf (G, H), 48 hpf (I, J), and 72 hpf (K, L). Arrows in J and L show TUNEL-positive profiles in the retina and arrowhead in panel H shows TUNEL positive profiles in lens. Bar = 50 μm; v, ventral; d, dorsal (magnification and orientation is the same for panels A-H). Embryos in panels C and I were not treated with PTU and therefore have dark retinal pigmented epithelium. Panel M shows average numbers of TUNEL-positive cells ± s.d at 36 (control n = 3; ethanol n=3), 48 (control n=3; ethanol n=9), and 72 hpf (control n=3; ethanol n=9) in retinas and lenses of untreated and ethanol-exposed embryos. Panels N and O show boxplots of lens circumference from two clutches of SH embryo strains at 48 hpf (N: Control n=12, 1% ethanol n=29, and 1.5% ethanol n = 33; O: Control n =11, 1% ethanol n =19, 1.5% ethanol n = 22). In the boxplots, the boxes delineate the 25th to 75th percentiles, the dark horizontal lines depict the medians, the whiskers depict the upper and lower limits, and the filled circles depict outliers as defined by R statistical software.
Fig. 4
Fig. 4
Cell proliferation and early retinal neurogenesis in the retinas of ethanol-treated embryos. Panels A–D show representative photos of retinas of untreated (A, C), and ethanol-exposed embryos (B, D), processed for anti-phospho histone H3 indirect immunofluorescence at 36 hpf (A, B), and 48 hpf (C, D). Thin gray circles indicate the locations of the lenses in the sections; thin gray semicircles indicate the positions of the retinal pigmented epithelium. Panels E–H show representative photos of retinas of untreated (E, G), and ethanol-exposed embryos (F, H), processed for pax6 in situ hybridization at 36 hpf (E, F), and 48 hpf (G, H). Panels I, K show representative photos of retinas of untreated (I), and ethanol-exposed embryos (K), processed for ath5 in situ hybridization at 36 hpf. Bar =50 μm; v, ventral; d, dorsal (magnification and orientation is the same for panels A-H); cm, ciliary margin; gcl, ganglion cell layer; inl, inner nuclear layer. Panel L shows average numbers ± s.d. of pH3-positive cells at 36 (control n = 8; ethanol n = 7) and 48 hpf (control n = 8; ethanol n = 13) in retinas of untreated and ethanol-exposed embryos.
Fig. 5
Fig. 5
Expression of retinal specific cell markers in ethanol-treated embryos. Panels A–F show representative photos of retinas of untreated embryos (A, C, E) and embryos exposed to ethanol from 24–48 hpf (B, D, F), processed for anti-islet-1 indirect immunofluorescence at 36 hpf (A, B), 48 hpf(C, D) and 72 hpf (E, F). Panels G–N show representative photos of retinas of untreated embryos (G, I, K, M) and embryos exposed to ethanol from 24–48 hpf and transferred to unmodified system water (H, J, L, N) at 72 hpf. Embryos were processed for indirect immunofluorescence using anti-PKC to detect rod bipolar cells (G, H), anti-GS to detect Müller glia (I, J), zpr1 to detect cone photoreceptors (K, L), and zpr3 to detect rod photoreceptors (M, N). Thin gray circles represent the lens, and thin gray semicircles represent the positions of the RPE in panels L, N. Bar=50 μm; v, ventral; d, dorsal; (magnification and orientation is the same for panels A–N); gcl, ganglion cell layer; inl, inner nuclear layer; onl, outer nuclear layer.
Fig. 6
Fig. 6
Expression of photoreceptor transcription factors at 72 hpf in embryos exposed to ethanol from 24–48 hpf. Panels A–F show representative photos of retinas of untreated (A, C, E) and ethanol exposed embryos (B, D, F) at 72 hpf. Tissue was processed for in situ hybridization using crx (A, B), neuroD (C, D) and rx1 (E, F). Bar= 50μm; v, ventral; d, dorsal; (magnification and orientation is the same for panels A–F); gcl, ganglion cell layer; inl, inner nuclear layer; onl, outer nuclear layer.
Fig. 7
Fig. 7
Differentiation of glia and photoreceptors recovers, although microphthalmia and reduced lens size persist in ethanol-exposed embryos. Panels A–F shows representative photos of retinas of untreated embryos (A, C, E) and embryos exposed to ethanol from 24–48 hpf and then transferred to unmodified system water (B, D, E) at 48 hpf and fixed at 96hpf. Embryos were processed for indirect immunofluorescence using zpr1 to detect cone photoreceptors (A, B), zpr3 to detect rod photoreceptors (C, D) and anti-GS to detect Müller glia (E, F). In A–D, thin gray circles represent the positions of the lenses. Bar = 50 μm; v, ventral; d, dorsal; (magnification and orientation is the same for panels A–F). Panels G and H show boxplots of eye and lens circumference measurements, respectively, from one clutch of SH embryos (control n =12; ethanol n =13). In the boxplots, the boxes delineate the 25th to 75th percentiles, the dark horizontal lines depict the medians, the whiskers depict the upper and lower limits, and the filled circles depict outliers as defined by R statistical software.

Similar articles

Cited by

References

    1. Ahlgren SC, Thakur V, Bronner-Fraser M. Sonic hedgehog rescues cranial neural crest from cell death induced by ethanol exposure. Proceedings of the National Academy of Sciences. 2002;99:10476–10481. - PMC - PubMed
    1. Arenzana FJ, Carvan MJ, 3rd, Aijon J, Sanchez-Gonzalez R, Arevalo R, Porteros A. Teratogenic effects of ethanol exposure on zebrafish visual system development. Neurotoxicology and Teratology. 2006;28:342–348. - PubMed
    1. Barthel LK, Raymond PA. Subcellular localization of alpha-tubulin and opsin mRNA in the goldfish retina using digoxigenin-labeled cRNA probes detected by alkaline phosphatase and HRP histochemistry. Journal of Neuroscience Methods. 1993;50:145–152. - PubMed
    1. Biehlmaier O, Neuhauss SC, Kohler K. Onset and time course of apoptosis in the developing zebrafish retina. Cell Tissue Research. 2001;306:199–207. - PubMed
    1. Bilotta J, Barnett JA, Hancock L, Saszik S. Ethanol exposure alters zebrafish development: A novel model of fetal alcohol syndrome. Neurotoxicology and Teratology. 2004;26:737–743. - PubMed

Publication types

MeSH terms

LinkOut - more resources