. 2007 Aug 15;43(4):610-8.
doi: 10.1016/j.freeradbiomed.2007.05.027. Epub 2007 May 31.

Regulatory mechanisms to control tissue alpha-tocopherol

Affiliations

Regulatory mechanisms to control tissue alpha-tocopherol

Debbie J Mustacich et al. Free Radic Biol Med. .

Abstract

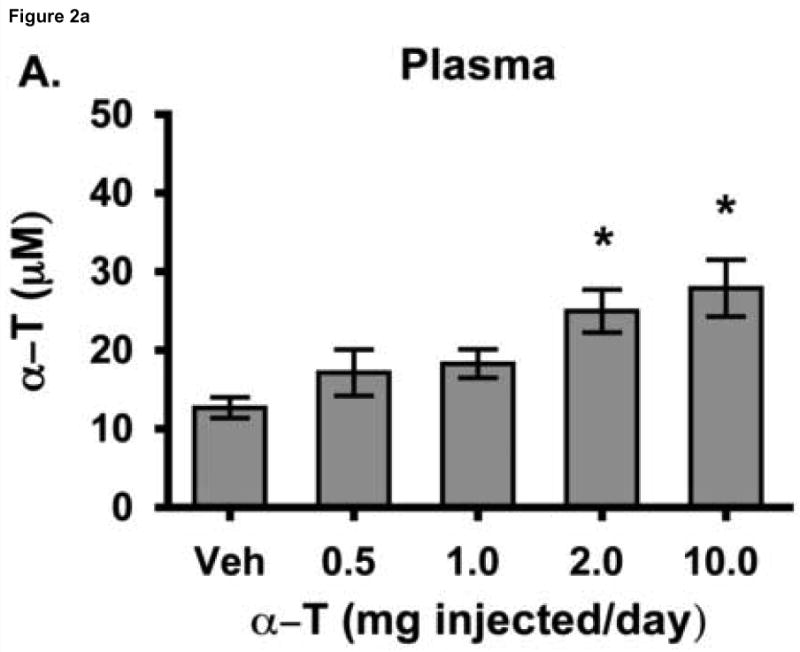
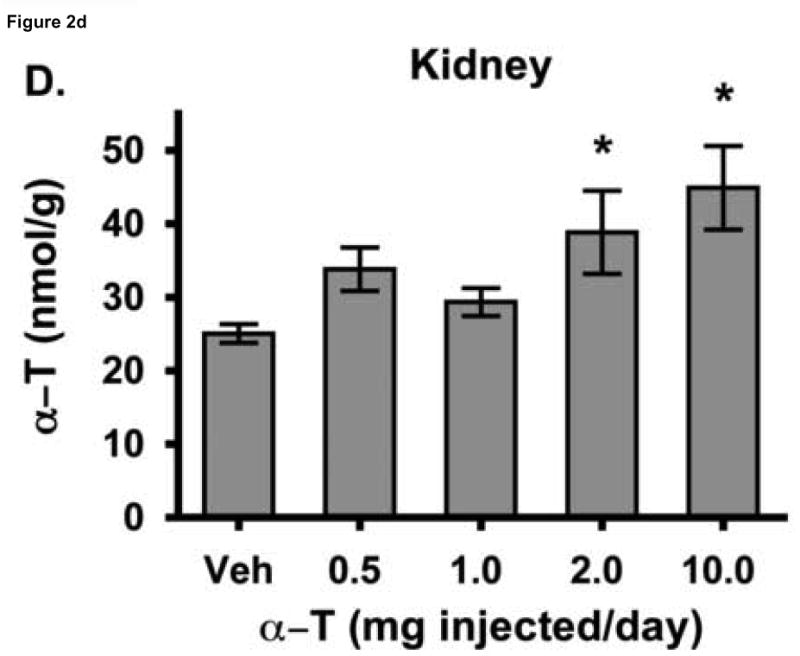
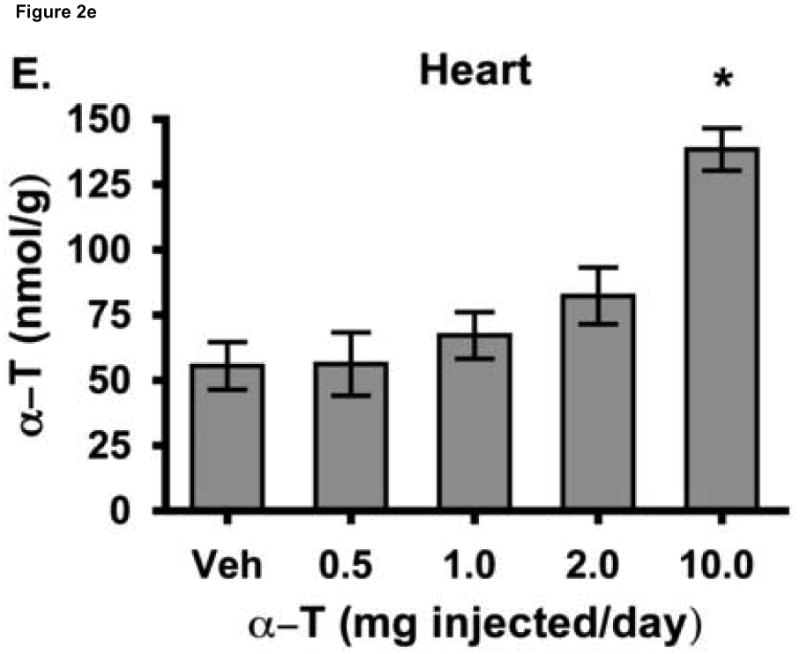
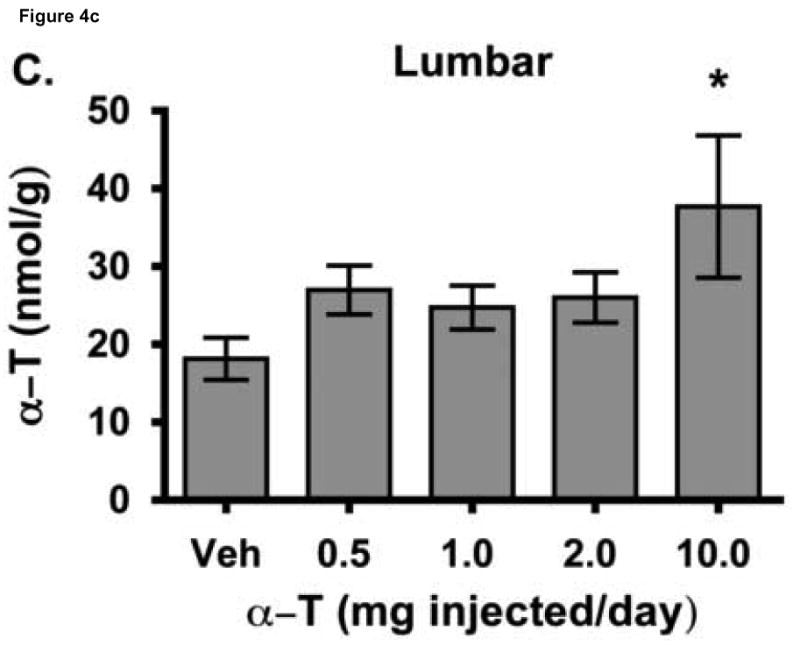
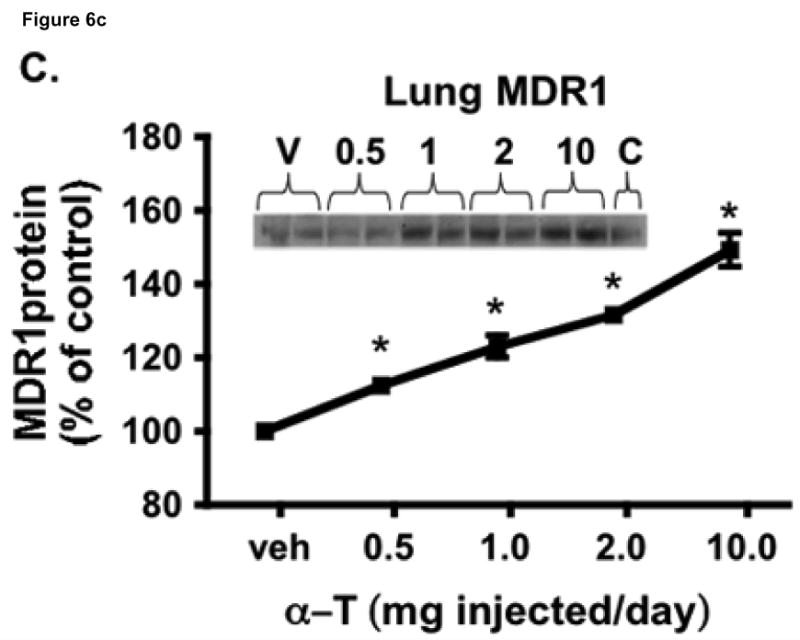
To test the hypothesis that hepatic regulation of alpha-tocopherol metabolism would be sufficient to prevent overaccumulation of alpha-tocopherol in extrahepatic tissues and that administration of high doses of alpha-tocopherol would up-regulate extrahepatic xenobiotic pathways, rats received daily subcutaneous injections of either vehicle or 0.5, 1, 2, or 10 mg alpha-tocopherol/100 g body wt for 9 days. Liver alpha-tocopherol increased 15-fold in rats given 10 mg alpha-tocopherol/100 g body wt (mg/100 g) compared with controls. Hepatic alpha-tocopherol metabolites increased with increasing alpha-tocopherol doses, reaching 40-fold in rats given the highest dose. In rats injected with 10 mg/100 g, lung and duodenum alpha-tocopherol concentrations increased 3-fold, whereas alpha-tocopherol concentrations of other extrahepatic tissues increased 2-fold or less. With the exception of muscle, daily administration of less than 2 mg/100 g failed to increase alpha-tocopherol concentrations in extrahepatic tissues. Lung cytochrome P450 3A and 1A levels were unchanged by administration of alpha-tocopherol at any dose. In contrast, lung P-glycoprotein (MDR1) levels increased dose dependently and expression of this xenobiotic transport protein was correlated with lung alpha-tocopherol concentrations (R(2)=0.88, p<0.05). Increased lung MDR1 may provide protection from exposure to environmental toxins by increasing alveolar space alpha-tocopherol.


Figures

Fig. 1
Fig. 1
Hepatic α-tocopherol concentrations in response to subcutaneous (SQ) vehicle or α-tocopherol injections. Vital E-300 was diluted to one of 4 α-tocopherol doses (0.5 mg, 1.0 mg, 2 mg, or 10 mg α-tocopherol/100 g body wt) with sterile saline. Rats (n = 4/group) received daily SQ injections of either vehicle (saline), or one of the four α-tocopherol doses for 9 days. On day 10, following a 12 h fast, rats were killed, blood collected and tissues were perfused with 0.9% saline (containing 2 U/ml heparin) using a perfusion catheter inserted into the heart. Tissues were excised and aliquots frozen in liquid N2 and stored at -80°C. α-Tocopherol concentrations were determined from SQ vehicle- and α-tocopherol-injected rats, as described in the methods. All values are expressed as mean ± SE, n = 4, with * = p < 0.01 as compared with vehicle-injected rats (see methods).
Fig. 2
Fig. 2
Plasma and tissue α-tocopherol concentrations in response to SQ vehicle or α-tocopherol injections. α-Tocopherol concentrations in (A) Plasma, (B) Muscle, (C) Lung, (D) Kidney, (E) Heart and (F) Adipose tissue were determined from SQ vehicle- and α-tocopherol-injected rats, as described in Fig 1 and the methods.
Fig. 2
Fig. 2
Plasma and tissue α-tocopherol concentrations in response to SQ vehicle or α-tocopherol injections. α-Tocopherol concentrations in (A) Plasma, (B) Muscle, (C) Lung, (D) Kidney, (E) Heart and (F) Adipose tissue were determined from SQ vehicle- and α-tocopherol-injected rats, as described in Fig 1 and the methods.
Fig. 3
Fig. 3
Intestinal tissue α-tocopherol concentrations in response to SQ vehicle and α-tocopherol injections. α-Tocopherol concentrations in (A) Duodenum, (B) Jejunum and (C) Ileum were determined from SQ vehicle- and α-tocopherol-injected rats, as described in Fig 1 and the methods.
Fig. 3
Fig. 3
Intestinal tissue α-tocopherol concentrations in response to SQ vehicle and α-tocopherol injections. α-Tocopherol concentrations in (A) Duodenum, (B) Jejunum and (C) Ileum were determined from SQ vehicle- and α-tocopherol-injected rats, as described in Fig 1 and the methods.
Fig. 3
Fig. 3
Intestinal tissue α-tocopherol concentrations in response to SQ vehicle and α-tocopherol injections. α-Tocopherol concentrations in (A) Duodenum, (B) Jejunum and (C) Ileum were determined from SQ vehicle- and α-tocopherol-injected rats, as described in Fig 1 and the methods.
Fig. 4
Fig. 4
Spinal cord α-tocopherol concentrations in response to SQ vehicle and α-tocopherol injections. α-Tocopherol concentrations in (A) Cervical, (B) Thoracic and (C) Lumbar regions of the spinal cord were determined from SQ vehicle- and α-tocopherol-injected rats, as described in Fig 1 and the methods.
Fig. 4
Fig. 4
Spinal cord α-tocopherol concentrations in response to SQ vehicle and α-tocopherol injections. α-Tocopherol concentrations in (A) Cervical, (B) Thoracic and (C) Lumbar regions of the spinal cord were determined from SQ vehicle- and α-tocopherol-injected rats, as described in Fig 1 and the methods.
Fig. 5
Fig. 5
α-Tocopherol and α-CEHC concentrations in response to SQ vehicle or α-tocopherol injections. α-Tocopherol and α-CEHC concentrations in (A) Liver, (B) Lung and (C) Kidney were determined from SQ vehicle- and α-tocopherol-injected rats, as described in Fig 1 and the methods. Points represent α-tocopherol (▼) and α-CEHC (●) concentrations for each individual animal. Data were analyzed and the curves generated by non-linear regression.
Fig. 5
Fig. 5
α-Tocopherol and α-CEHC concentrations in response to SQ vehicle or α-tocopherol injections. α-Tocopherol and α-CEHC concentrations in (A) Liver, (B) Lung and (C) Kidney were determined from SQ vehicle- and α-tocopherol-injected rats, as described in Fig 1 and the methods. Points represent α-tocopherol (▼) and α-CEHC (●) concentrations for each individual animal. Data were analyzed and the curves generated by non-linear regression.
Fig. 6
Fig. 6
Lung immunoreactive protein concentrations in response to SQ vehicle and α-tocopherol injections. Lung microsomes and membrane fractions were prepared as described in the methods from SQ vehicle- and α-tocopherol-injected rats. Lung microsomal protein (50 μg) and membrane protein (75 μg) were used for determination of CYPs and MDR1 protein expression, respectively (see Methods). Actin was detected on each blot for use as a loading control as described in the methods. The actin-normalized protein levels of vehicle-injected rats (controls) were set to 100% and protein levels from SQ α-tocopherol-injected rats are expressed as percent of control. Quantification of the indicated protein levels by densitometry: (A) CYP3A, (B) CYP1A and (C) MDR1. Each time point represents mean ± SE of 4 rats (error bars may be smaller than the symbols). Insect microsomes expressing the individual rat CYP protein of interest were utilized as controls to confirm the identification of bands on each CYP blot. MES-SA/D×5 cell lysates (Santa Cruz) that express MDR1 were used as a control on MDR1 blots. A representative western blot of lung MDR1 protein expression is inset in (C) with V = vehicle, 0.5, 1, 2, and 10 = α-tocopherol dose, and C = MES-SA/D×5. (D) Correlation of MDR1 protein levels with lung vitamin E concentrations (R2 = 0.88, P < 0.001).
Fig. 6
Fig. 6
Lung immunoreactive protein concentrations in response to SQ vehicle and α-tocopherol injections. Lung microsomes and membrane fractions were prepared as described in the methods from SQ vehicle- and α-tocopherol-injected rats. Lung microsomal protein (50 μg) and membrane protein (75 μg) were used for determination of CYPs and MDR1 protein expression, respectively (see Methods). Actin was detected on each blot for use as a loading control as described in the methods. The actin-normalized protein levels of vehicle-injected rats (controls) were set to 100% and protein levels from SQ α-tocopherol-injected rats are expressed as percent of control. Quantification of the indicated protein levels by densitometry: (A) CYP3A, (B) CYP1A and (C) MDR1. Each time point represents mean ± SE of 4 rats (error bars may be smaller than the symbols). Insect microsomes expressing the individual rat CYP protein of interest were utilized as controls to confirm the identification of bands on each CYP blot. MES-SA/D×5 cell lysates (Santa Cruz) that express MDR1 were used as a control on MDR1 blots. A representative western blot of lung MDR1 protein expression is inset in (C) with V = vehicle, 0.5, 1, 2, and 10 = α-tocopherol dose, and C = MES-SA/D×5. (D) Correlation of MDR1 protein levels with lung vitamin E concentrations (R2 = 0.88, P < 0.001).
Fig. 7
Fig. 7
Kidney CYP4F immunoreactive protein concentrations in response to SQ vehicle and α-tocopherol injections. Kidney microsomes were prepared from SQ vehicle- and α-tocopherol-injected rats, as in the methods. Kidney microsomal protein samples were analyzed by western blot, quantified by densitometry, normalized to actin expression (see methods) and are expressed as percent of control as described in figure 6. Each time point represents mean ± SE of 4 rats (error bars may be smaller than symbols). Insect microsomes expressing CYP4F protein were utilized to confirm the identification of bands.

Similar articles

Cited by

References

    1. Traber MG, Burton GW, Hamilton RL. Vitamin E trafficking. Ann NY Acad Sci. 2005;1031:1–12. - PubMed
    1. Schultz M, Leist M, Petrzika M, Gassmann B, Brigelius-Flohé R. Novel urinary metabolite of alpha-tocopherol, 2,5,7,8-tetramethyl-2(2′-carboxyethyl)-6-hydroxychroman, as an indicator of an adequate vitamin E supply? Am J Clin Nutr. 1995;62(suppl):1527S–1534S. - PubMed
    1. Sontag TJ, Parker RS. Cytochrome P450 omega-hydroxylase pathway of tocopherol catabolism: Novel mechanism of regulation of vitamin E status. J Biol Chem. 2002;277:25290–25296. - PubMed
    1. Mustacich DJ, Leonard SW, Devereaux MW, Sokol RJ, Traber MG. α-Tocopherol regulation of hepatic cytochrome P450s and ABC transporters in rats. Free Radic Biol Med. 2006;41:1069–1078. - PubMed
    1. Traber MG, Siddens LK, Leonard SW, Schock B, Gohil K, Krueger SK, Cross CE, Williams DE. α-Tocopherol modulates Cyp3a expression, increases γ-CEHC production and limits tissue γ-tocopherol accumulation in mice fed high γ-tocopherol diets. Free Radic Biol Med. 2005;38:773–785. - PubMed

Publication types

MeSH terms

Substances