. 2007 Oct 15;466(2):177-85.
doi: 10.1016/j.abb.2007.06.007. Epub 2007 Jun 15.

Depletion of S-adenosyl-l-methionine with cycloleucine potentiates cytochrome P450 2E1 toxicity in primary rat hepatocytes

Affiliations

Depletion of S-adenosyl-l-methionine with cycloleucine potentiates cytochrome P450 2E1 toxicity in primary rat hepatocytes

Jian Zhuge et al. Arch Biochem Biophys. .

Abstract

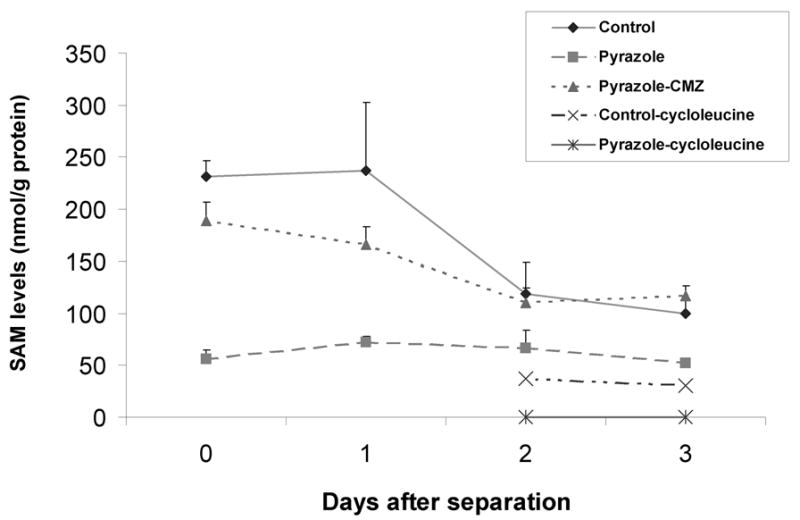
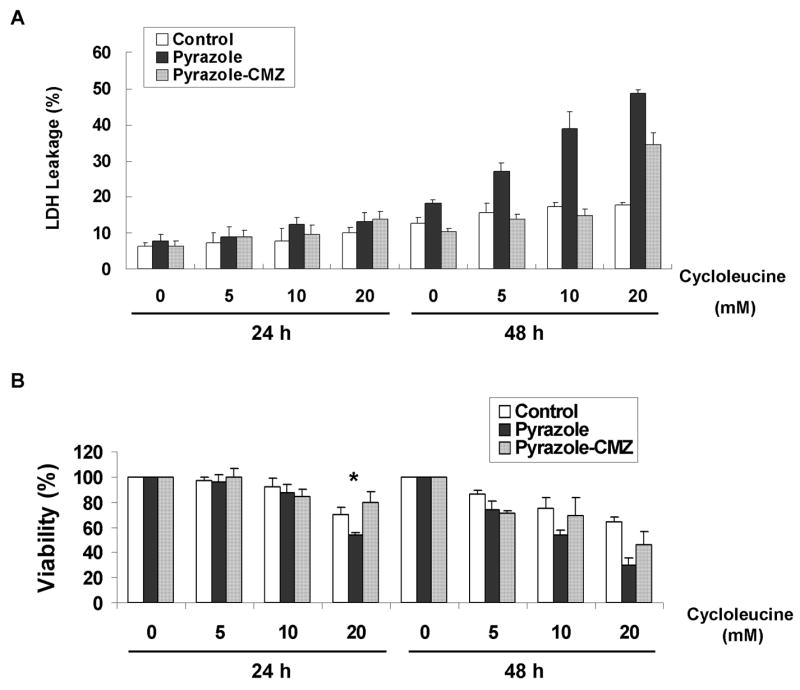
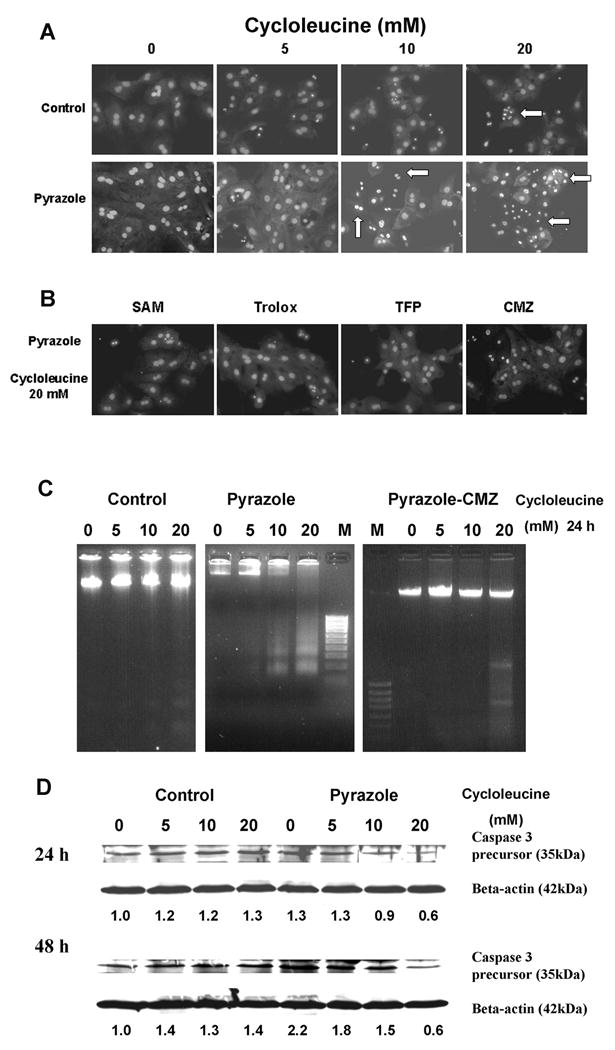
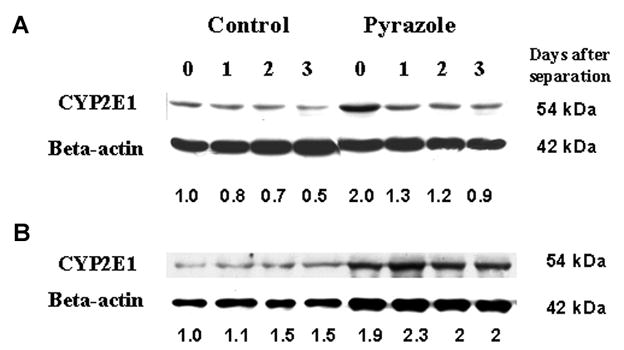
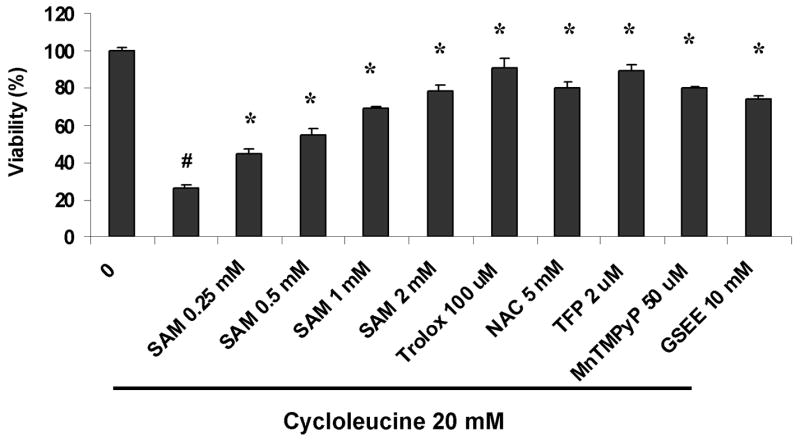
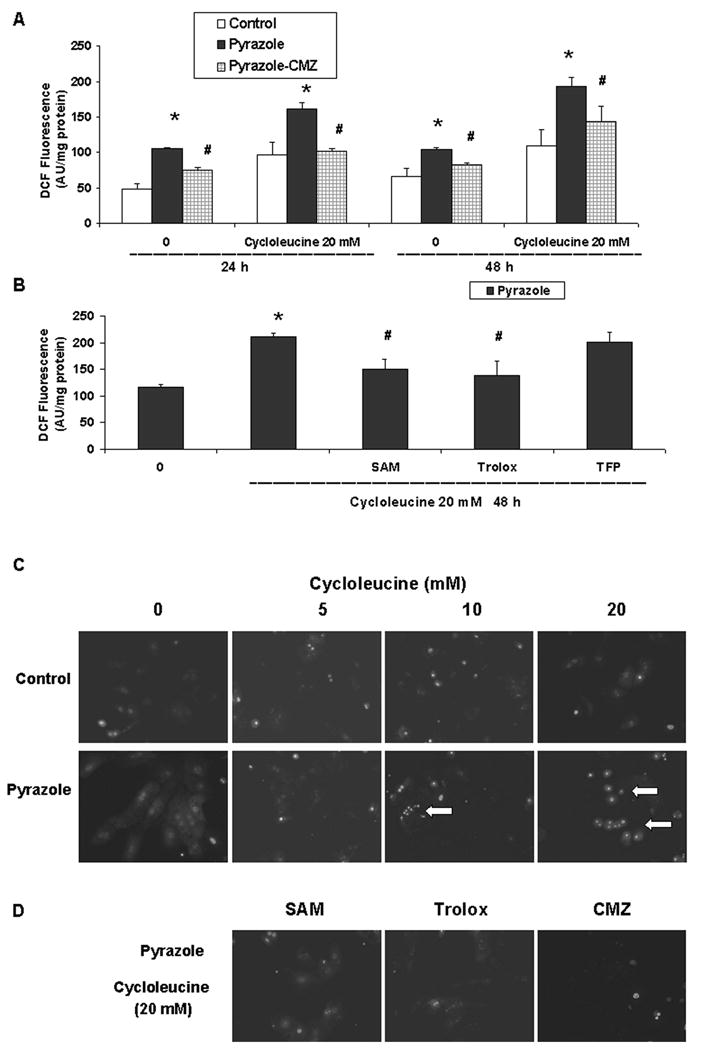
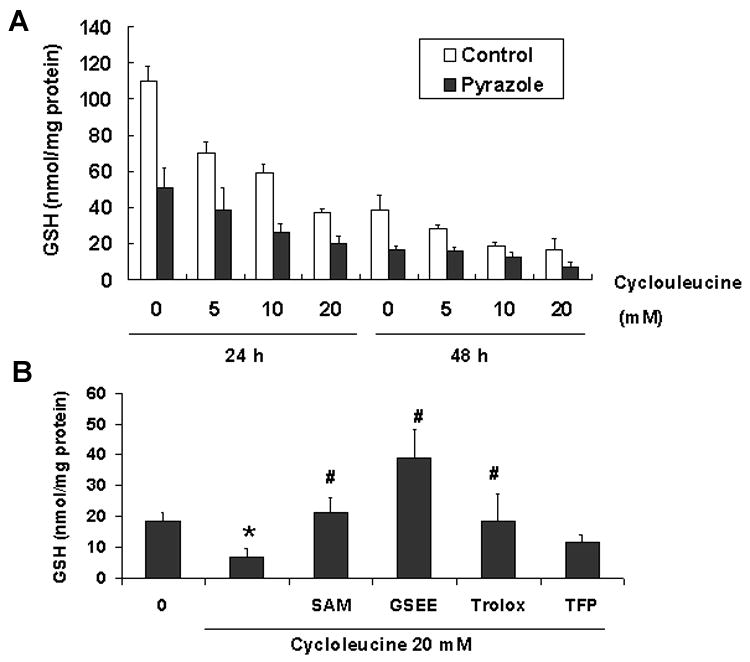
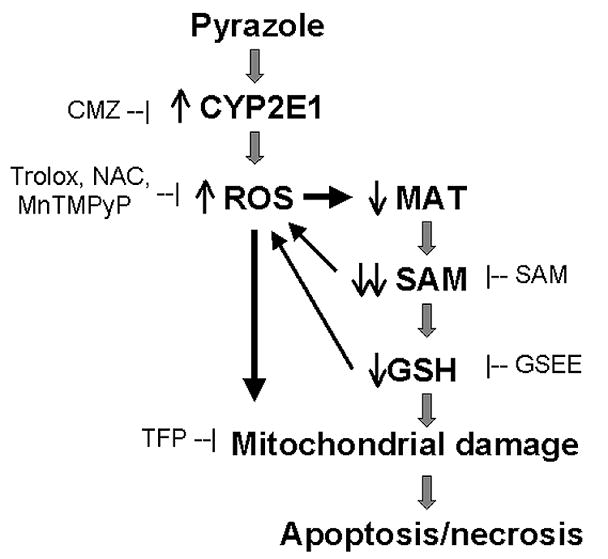
S-Adenosyl-l-methionine (SAM) is the principal biological methyl donor. Methionine adenosyltransferase (MAT) catalyzes the only reaction that generates SAM. Hepatocytes were treated with cycloleucine, an inhibitor of MAT, to evaluate whether hepatocytes enriched in cytochrome P450 2E1 (CYP2E1) were more sensitive to a decline in SAM. Cycloleucine decreased SAM and glutathione (GSH) levels and induced cytotoxicity in hepatocytes from pyrazole-treated rats (with an increased content of CYP2E1) to a greater extent as compared to hepatocytes from saline-treated rats. Apoptosis caused by cycloleucine in pyrazole hepatocytes appeared earlier and was more pronounced than control hepatocytes and could be prevented by incubation with SAM, glutathione reduced ethyl ester and antioxidants. The cytotoxicity was prevented by treating rats with chlormethiazole, a specific inhibitor of CYP2E1. Cycloleucine induced greater production of reactive oxygen species (ROS) in pyrazole hepatocytes than in control hepatocytes, and treatment with SAM, Trolox, and chlormethiazole lowered ROS formation. In conclusion, lowering of hepatic SAM levels produced greater toxicity and apoptosis in hepatocytes enriched in CYP2E1. This is due to elevated ROS production by CYP2E1 coupled to lower levels of hepatoprotective SAM and GSH. We speculate that such interactions e.g. induction of CYP2E1, decline in SAM and GSH may contribute to alcohol liver toxicity.


Figures

Fig. 1
Fig. 1
SAM levels in isolated hepatocytes before or after culture in vitro with or without cycloleucine treatment. Five million hepatocytes from control, pyrazole-treated, or pyrazole plus chlormethiazole (CMZ) treated rats were collected and not incubated (day 0) or were incubated in 15 cm dishes for 1, 2, or 3 days. Some hepatocytes were treated on day 1 with 20 mM cycloleucine for 24 or 48 h (day 2 or 3). Cells that were not incubated or cells collected on days 1, 2, or 3 after culture, were treated with HClO4 and SAM levels were assayed by high performance liquid chromatography as described in Materials and Methods.
Fig. 2
Fig. 2
Cytotoxicity assay after cycloleucine treatment. Ten thousand rat hepatocytes were incubated with HepatoZYME medium containing 0, 5, 10, or 20 mM of cycloleucine in 24-well plates for 24 or 48 h. (A) Cell membrane damage was evaluated by LDH leakage. One representative result of two is shown. (B) Cell viability after treatment with different amounts of cycloleucine was assayed with MTT. The A570–630nm of hepatocytes treated with 0 mM of cycloleucine was taken as the 100% viability value. * P<0.005 vs control hepatocytes treated with 20 mM cycloleucine.
Fig. 3
Fig. 3
Cycloleucine-induced apoptosis in rat hepatocytes. (A) Morphology of hepatocyte nuclei after 48 h treatment with 0, 5, 10 or 20 mM of cycloleucine (Magnification, ×600). Apoptotic hepatocytes displayed condensation of nuclear chromatin (arrows). (B) Morphology of pyrazole hepatocyte nuclei after 48 h of treatment with 20 mM cycloleucine plus 2 mM SAM, or plus 100 μM Trolox, or plus 2 μM TFP, or hepatocytes from pyrazole plus CMZ treated rats treated with 20 mM of cycloleucine. (C) DNA ladder induced by cycloleucine treatment. One million hepatocytes from control, pyrazole, or pyrazole plus CMZ treated rats were seeded into 10 cm dishes and treated with 0, 5, 10, or 20 mM of cycloleucine for 24 h. DNA fragmentation was assayed as described in Materials and Methods. M, 100 bp DNA ladder marker (Fermetas Inc., Hanover, MD). One representative experiment of three is shown. (D) Western blot analysis of caspase 3 precursor. One million hepatocytes were seeded into 10 cm dishes and treated with 0, 5, 10, or 20 mM of cycloleucine for 24 or 48 h, and 75 μg of cell lysate was subjected to 20% SDS-PAGE. The same membrane was stripped and reblotted with anti-β-actin antibody as loading control. Numbers below the blots refer to the caspase 3 precursor/βactin ratio. The caspase 3 precursor/β-actin ratio of control hepatocytes treated with 0 cycloleucine is taken as 1.
Fig. 4
Fig. 4
CYP2E1 expression. (A) Western blot analysis of CYP2E1 expression after the separation of hepatocytes (day 0) and after culture in 10 cm dishes for 1, 2, and 3 days. (B) Western blot analysis of CYP2E1 expression after treatment with 0, 5, 10, or 20 mM cycloleucine for 24 h. Quantification of bands with β-actin as loading control is shown below the blots. In (A) the 0 day control CYP2E1/β-actin ratio and in (B) the control hepatocytes treated with 0 mM cycloleucine CYP2E1/β-actin ratio are taken as a ratio of 1. One representative experiment of three is shown.
Fig. 5
Fig. 5
Protection against loss of cell viability induced by cycloleucine in pyrazole-treated hepatocytes. Hepatocytes (1×10⁵ cells) from pyrazole-treated rats were seeded onto 6-well plates, and treated with 20 mM of cycloleucine. Some cells were also treated with either 0.25, 0.5, 1, 2 mM SAM, or 100 μM trolox, or 2 μM TFP, or 50 μM MnTMPyP, or 10 mM GSEE. After incubation for 48 h, cell viability was determined by the MTT assay. Relative viability refers to the 100% × A570–630 nm of cells with treatment/A570–630 nm of cells without any treatment (0 cycloleucine). # P<0.001, t test vs hepatocytes without any treatment. * P<0.001, one-way ANOVA, vs cycloleucine treated pyrazole hepatocytes.
Fig. 6
Fig. 6
Intracellular ROS production. (A) Intracellular ROS levels of hepatocytes from control, pyrazole, or pyrazole plus CMZ treated rats were assayed using DCF fluorescence after treatment with 0 or 20 mM cycloleucine for 24 or 48 h. The results are expressed as arbitrary units of the fluorescence intensity per mg of protein. * P<0.05, t test vs the same time point for control hepatocytes. # P<0.01 vs the same time point for pyrazole hepatocytes. (B) Effect of treatment with 20 mM cycloleucine plus 2 mM SAM, or 100 μM Trolox or 2 μM TFP on ROS levels. One-way ANOVA, * P<0.001, vs pyrazole hepatocytes without any cycloleucine treatment, # P<0.005, vs pyrazole hepatocytes treated with 20 mM cycloleucine for 48 h. (C) Production of O2•− was assayed using dihydroethidium after treatment with 0 to 20 mM cycloleucine for 48 h as described in Materials and Methods. Images were visualized with a fluorescent microscope (Magnification, × 600). Arrows indicate strong red fluorescence in the nuclei. (D) Effect of treatment with 20 mM cycloleucine plus either 2 mM SAM or 100 μM trolox, on O2•− production by pyrazole hepatocytes or O2•− production by hepatocytes isolated from rats treated with pyrazole plus CMZ and incubated with 20 mM of cycloleucine.
Fig. 7
Fig. 7
Intracellular levels of reduced glutathione (GSH). (A) GSH levels were determined as described in Materials and Methods after incubating with or without cycloleucine for the indicated times. (B) Effect of treatment with 20 mM cycloleucine plus 2 mM SAM, or 10 mM GSEE, or 100 μM trolox, or 2 μM TFP on intracellular GSH levels. One way ANOVA * P<0.001, vs pyrazole hepatocytes without any cycloleucine treatment, # P<0.001, vs pyrazole hepatocytes treated with 20 mM cycloleucine for 48 h.
Fig. 8
Fig. 8
Summary of a proposed mechanism for the enhancement of cell death induced by cycloleucine treatment of pyrazole hepatocytes. Pyrazole elevates CYP2E1 expression and increases intracellular production of ROS. Increases in ROS inhibit methionine adenosyltransferase (MAT) 1A, which combined with cycloleucine inhibition of MAT1A dramatically decrease levels of S-adenosyl-L-methionine (SAM) and GSH. These decreases further potentiation oxidative stress, which results in decreased mitochondrial membrane potential. This ultimately leads to apoptosis and necrosis. Sites within this scheme where CMZ, SAM, GSEE, Trolox, NAC, MnTMPyP, or TFP react are shown to clarify how these additions protect against the cycloleucine plus CYP2E1 enhanced toxicity.

Similar articles

Cited by

References

    1. Lieber CS. Am J Clin Nutr. 2002;76:1183S–1187S. - PubMed
    1. Ahmad I, Rao DN. Crit Rev Biochem Mol Biol. 1996;31:361–380. - PubMed
    1. Boelsterli UA, Rakhit G, Balazs T. Hepatology. 1983;3:12–17. - PubMed
    1. Chawla RK, Bonkovsky HL, Galambos JT. Drugs. 1990;40(Suppl 3):98–110. - PubMed
    1. Mato JM, Corrales FJ, Lu SC, Avila MA. Faseb J. 2002;16:15–26. - PubMed

Publication types

MeSH terms

LinkOut - more resources